

Gold ($XAU ) prices are struggling to recover from the support near $4,850. The market is looking for the key $5,000 as markets await the Fed Minutes. The expectations of rate cuts are keeping the tone supportive for gold. Therefore, the price dips in gold are limited and attract new buying interest.
Dovish comments from Federal Reserve officials also add support for recovery in precious metals. If inflation continues to cool, then the case for rate cuts becomes stronger. At the same time, uncertainty about the US-Iran talks is contributing to a moderate safe haven bid. This geopolitical risk is supporting gold when liquidity is thin.
Experts Trade Gold with Vantage
Trading derivatives carries significant risks. It is not suitable for all investors and if you are a professional client, you could lose substantially more than your initial investment. When acquiring our derivative products, you have no entitlement, right or obligation to the underlying financial assets. Past performance is no indication of future performance and tax laws are subject to change. The information on this website is general in nature and doesn't take into account your personal obje
On the other hand, silver ($XAG ) is subjected to greater volatility because it is sensitive to both monetary policy and industrial demand. However, as long as markets expect policy easing later in the year, the bigger picture for gold and silver is positive.
Gold Technical Analysis
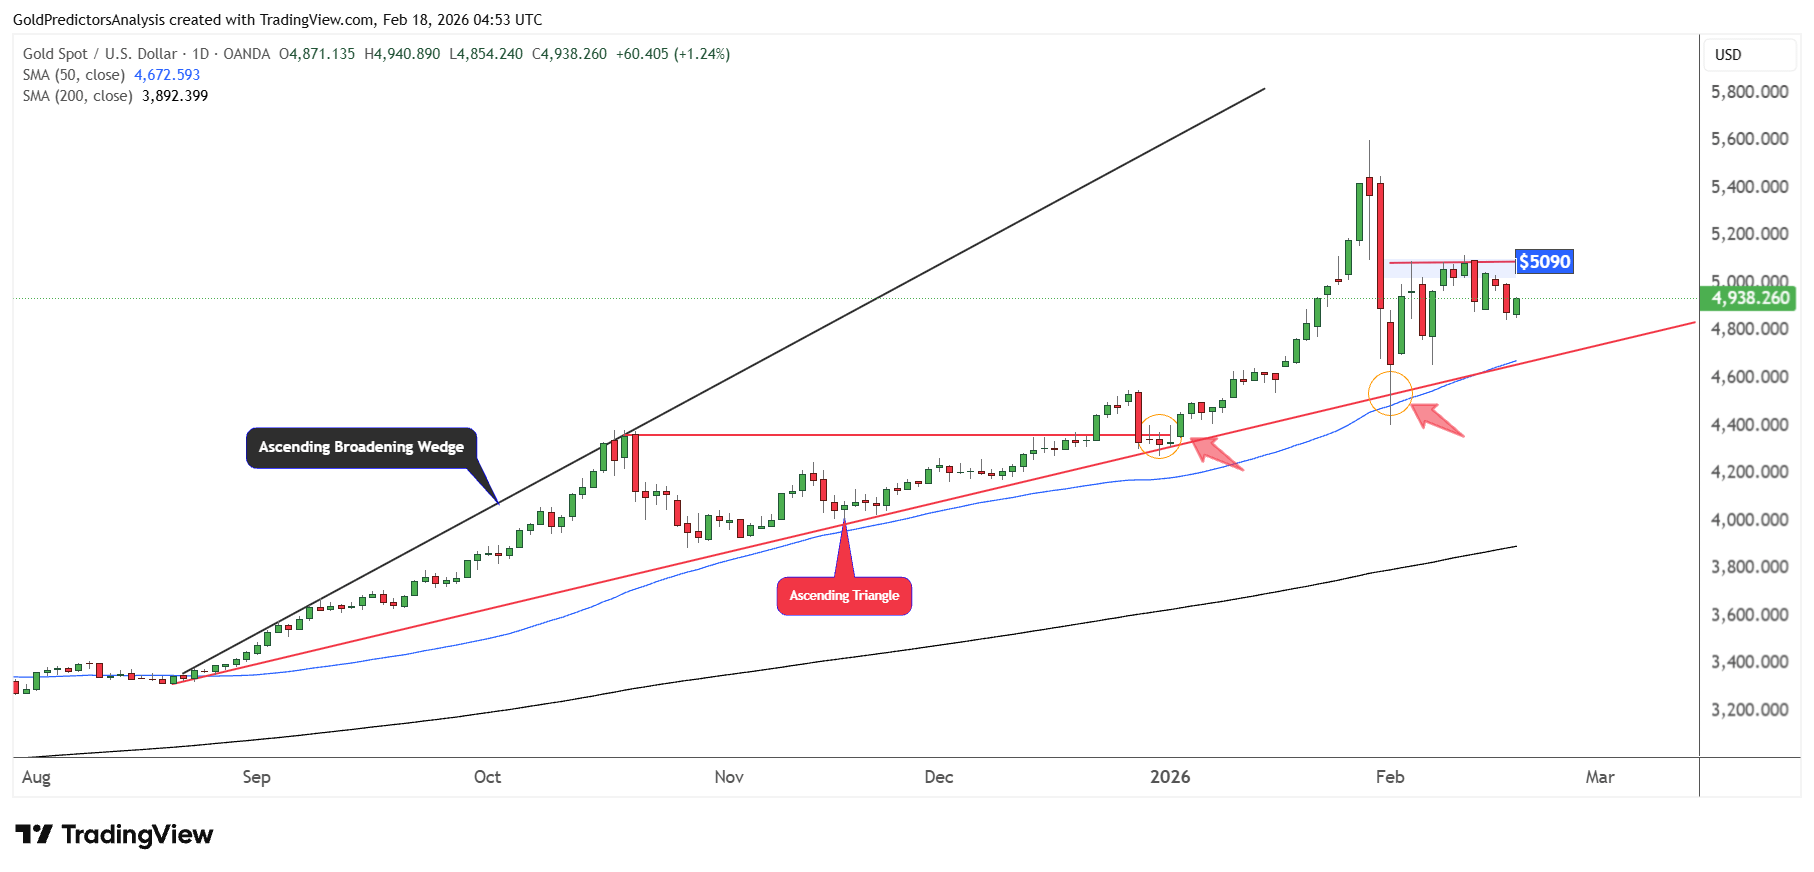
Gold Daily – Ascending Broadening Wedge
The daily chart for spot gold shows strong consolidation below $5,090. This consolidation indicates positive price action in gold since the price is consolidating above the 50-day SMA and within the ascending broadening wedge pattern.
The possibility of an upside breakout above $5,090 increases. However, a break below $4,670 will indicate further downside towards $4,400. As long as the price remains above $4,670, the possibility of an upside breakout remains likely.
Gold 4-Hour – Consolidation
These consolidations are also observed on the 4-hour chart, which shows the key levels of $5,100 and $4,770. The strong reversal from $4,400 above the red highlighted region, and then consolidation in a tight range, indicates that the price is preparing for next move.
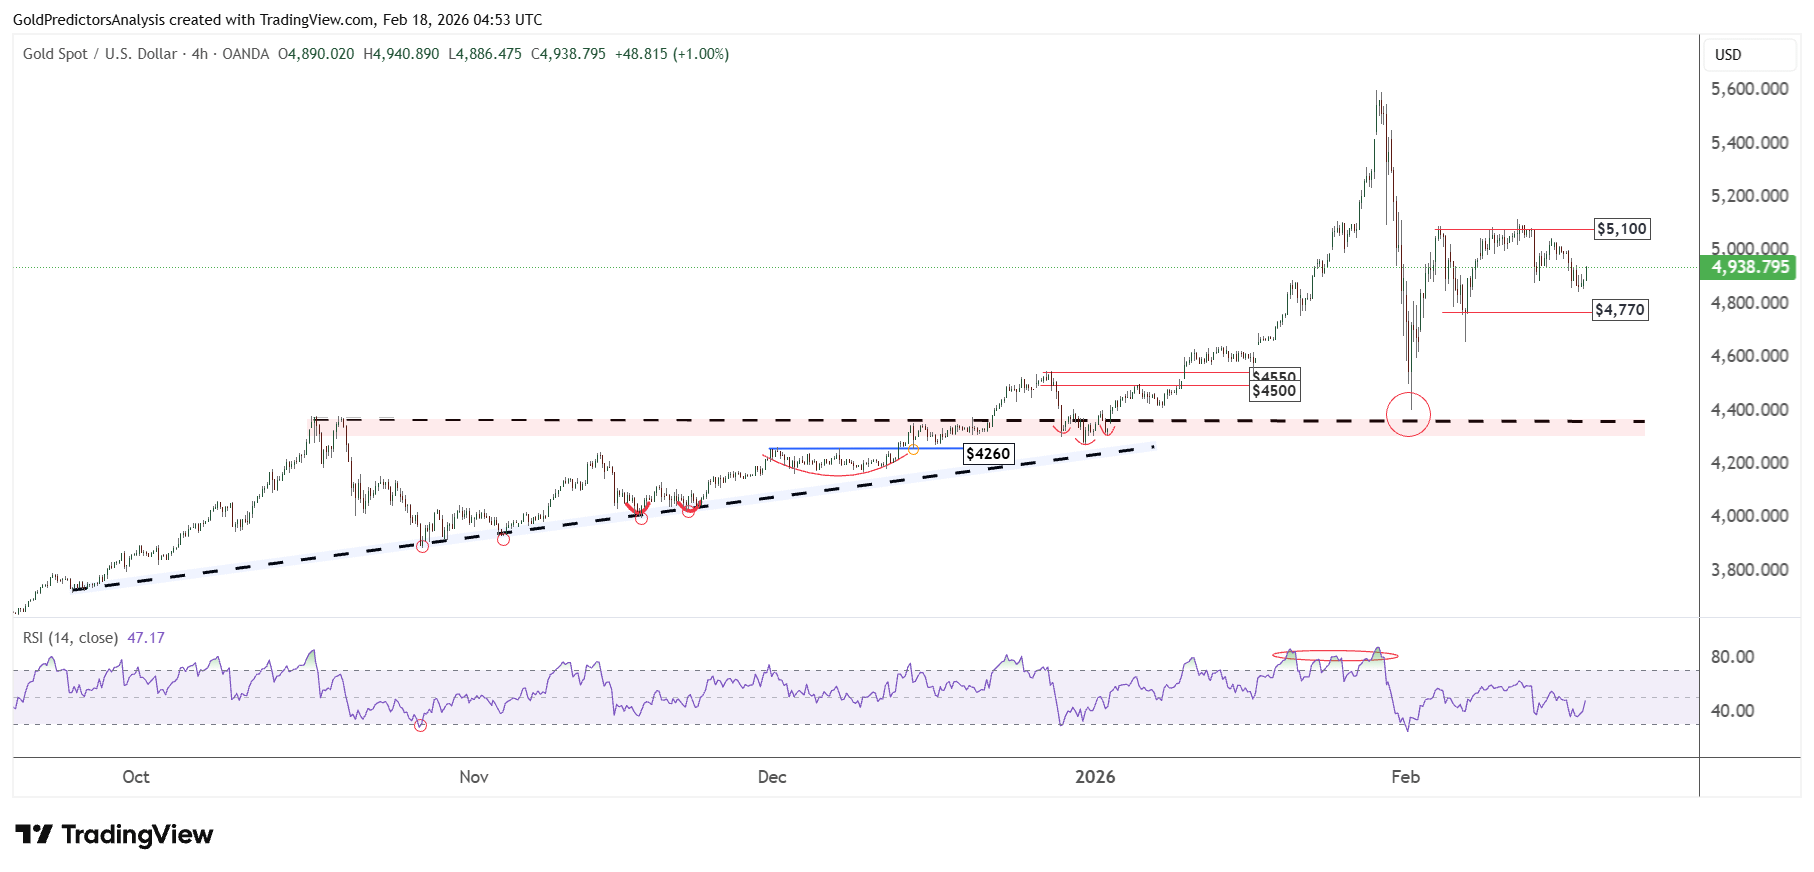
A confirmed break below $4,670 will indicate further downside towards $4,400. On the other hand, a break above $5,100 will indicate further upside toward $5,600. The overall price structure remains bullish in the short term. Moreover, the RSI has also rebounded from the lower levels, which increases the possibility of an upside breakout.
Silver Technical Analysis
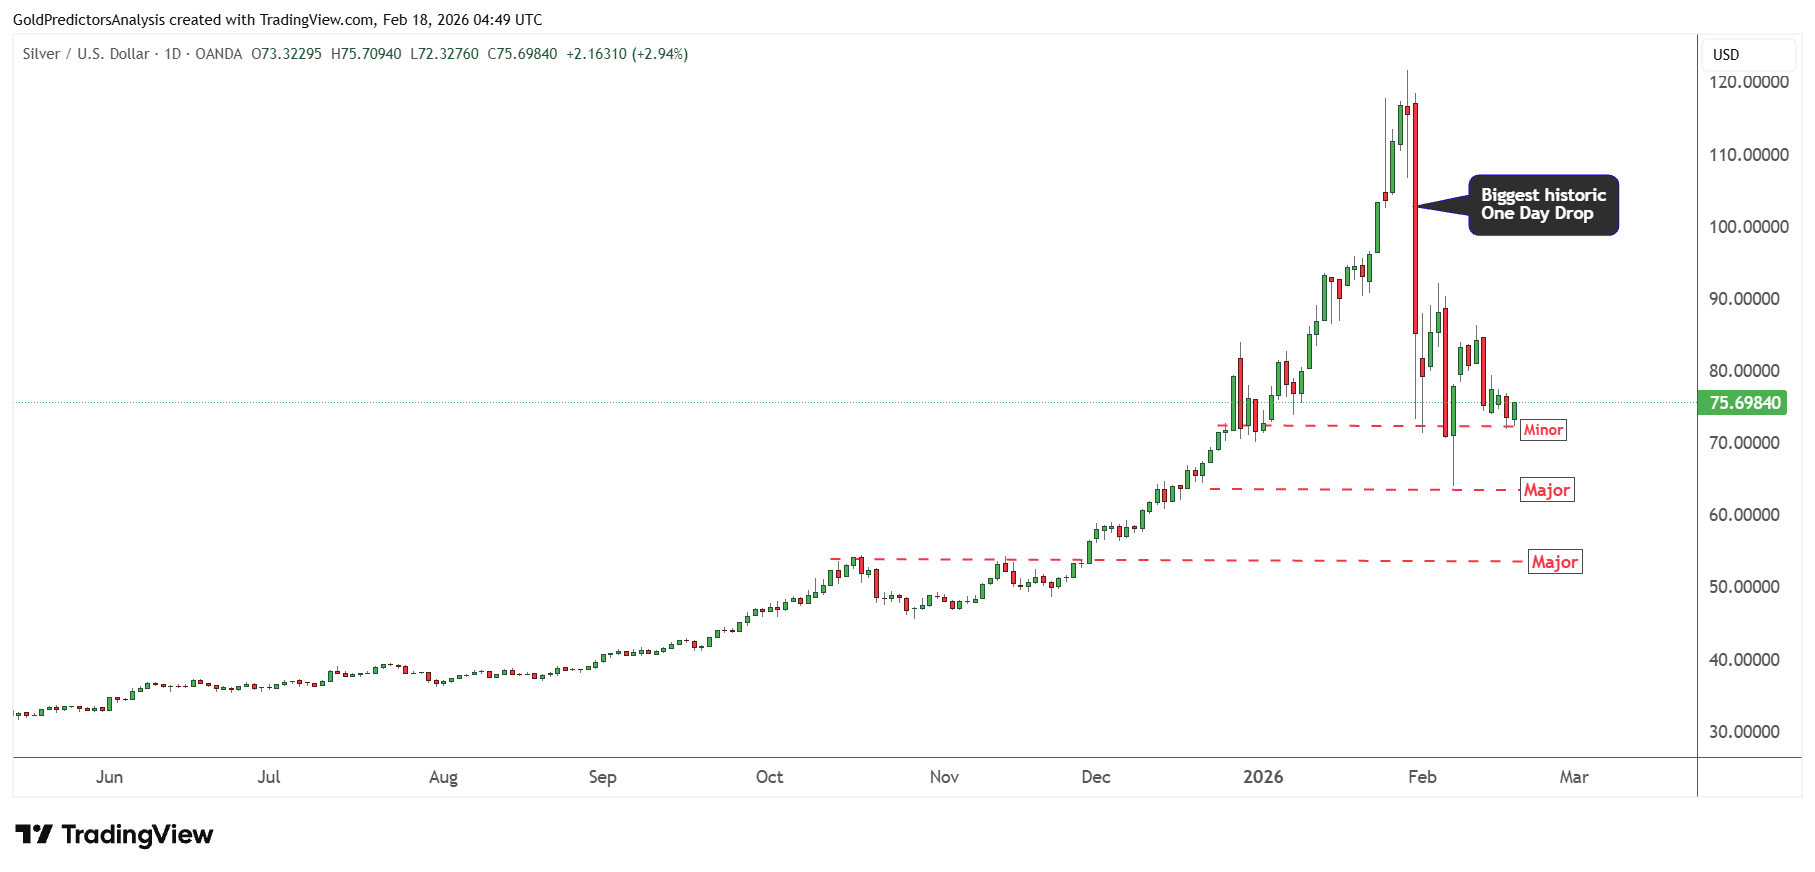
Silver Daily – Rebound from Key Support
The correction in silver on Tuesday again hit the minor support of $72.50, whereby the price initiated a rebound from this level. The price is consolidating above these levels to form base pattern. These base patterns may initiate another rally in silver in 2026. As long as the price remains above the major $50 support zone, the silver market will continue higher in 2026.
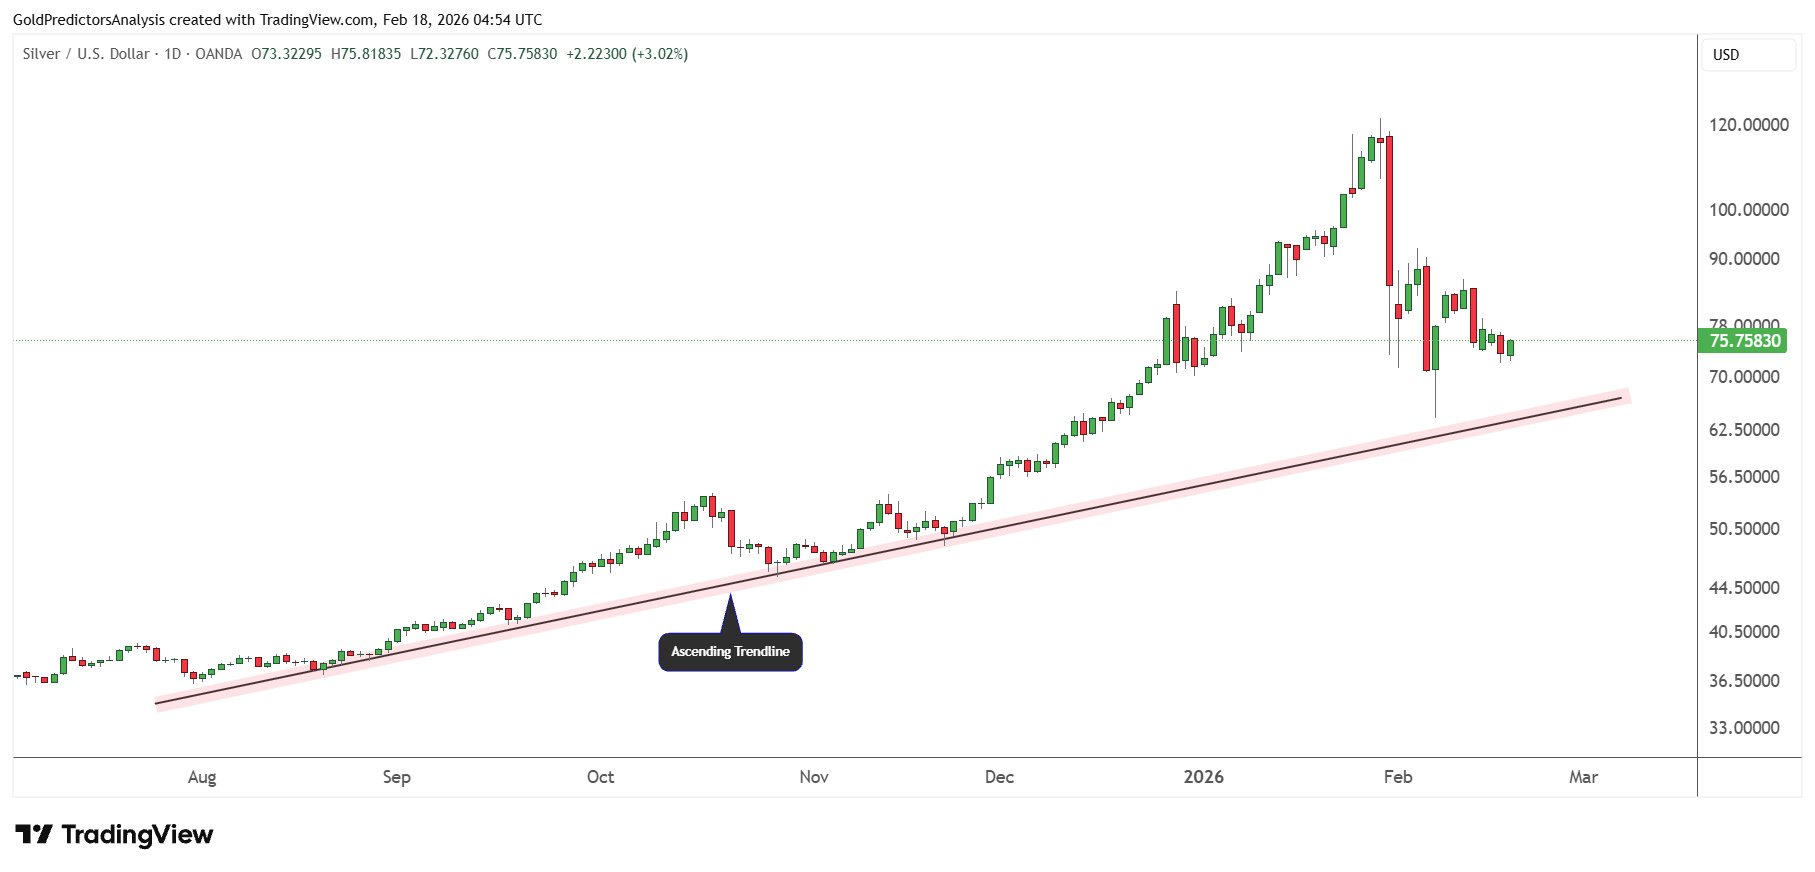
The strong uptrend in silver is also evident in the ascending trend line, which is drawn from the July 2025 lows and trending upward. The major support of this trend line lies around $60-$64, which has already hit and price is preparing for next move.
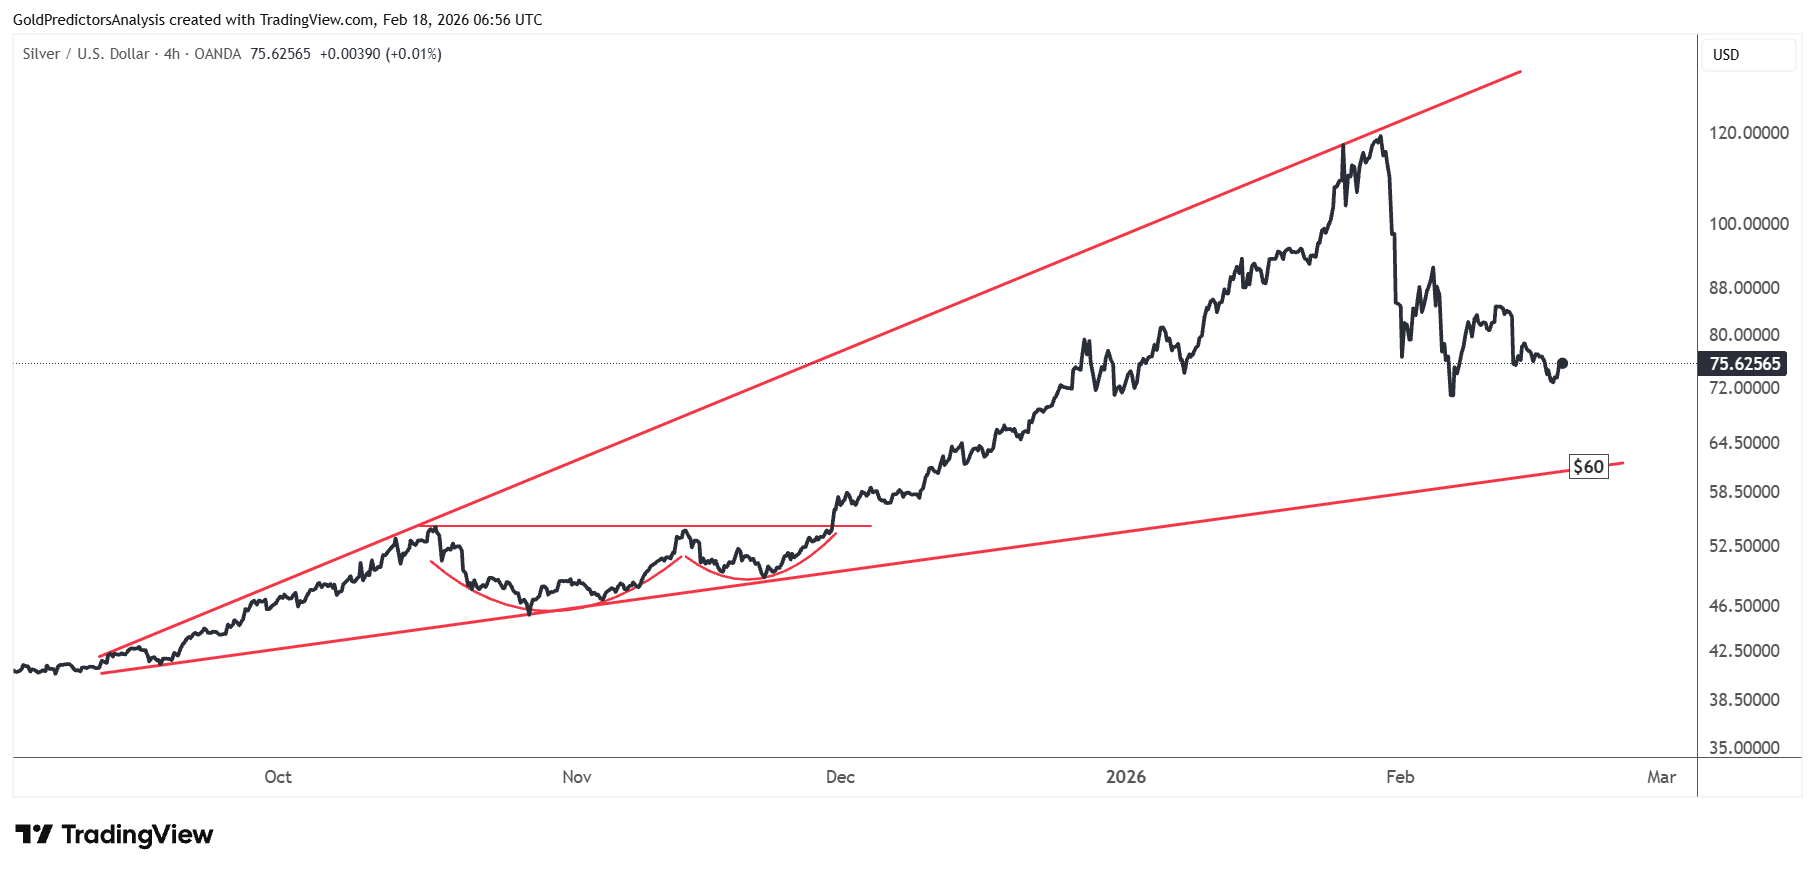
Silver 4-Hour – Ascending Broadening Wedge
The 4-hour chart for silver shows strong consolidation within the ascending broadening wedge pattern. The recent correction from $120 has reached $64, which is near the $60 support of the ascending broadening wedge pattern.
As long as $60 holds, the next move in silver will likely be higher. Due to the structure of the ascending broadening wedge pattern, the market builds increasing volatility for the next phase of growth.
US Dollar Technical Analysis
US Dollar Daily – Consolidation
The daily chart for U.S. Dollar Index shows consolidation between 96.50 and 100.50. However, the price is weak, and the index is consolidating below 50- and 200-day SMAs at lower levels. This consolidation within negative trend increases the possibility of a downside breakout below 96.
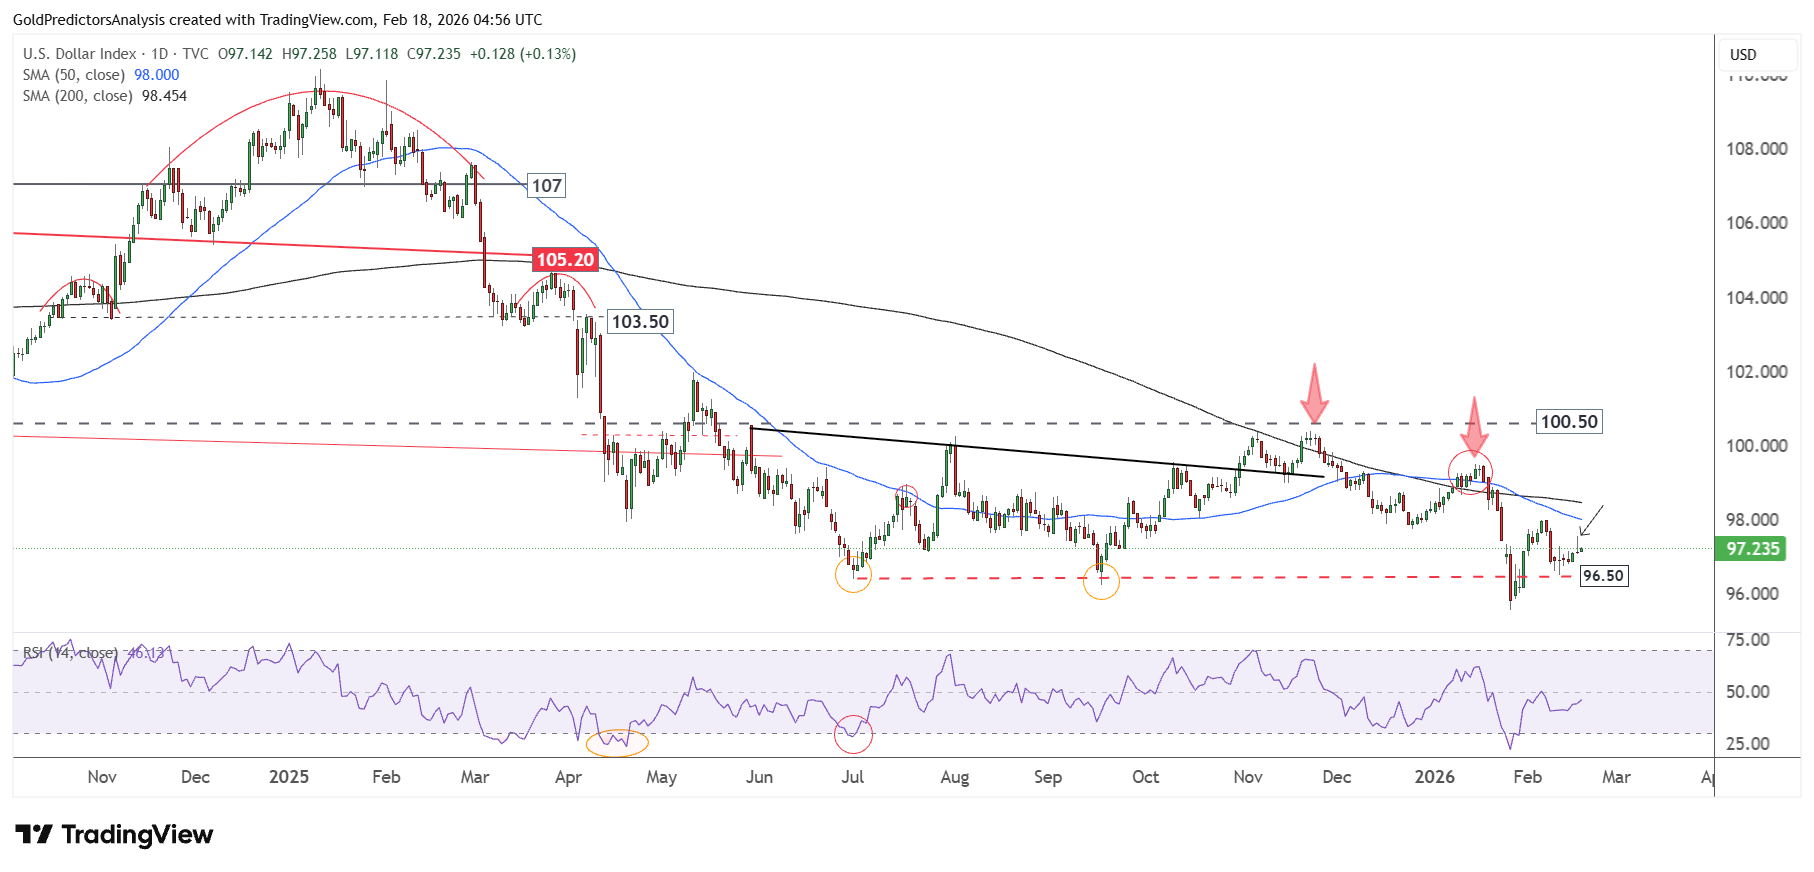
A break below 96 will indicate a strong drop in U.S. Dollar Index towards 90. However, a recovery above 98.50 will indicate further upside towards 100.50. As long as the U.S. Dollar Index remains below 100.50, the next move in the index will likely be lower.
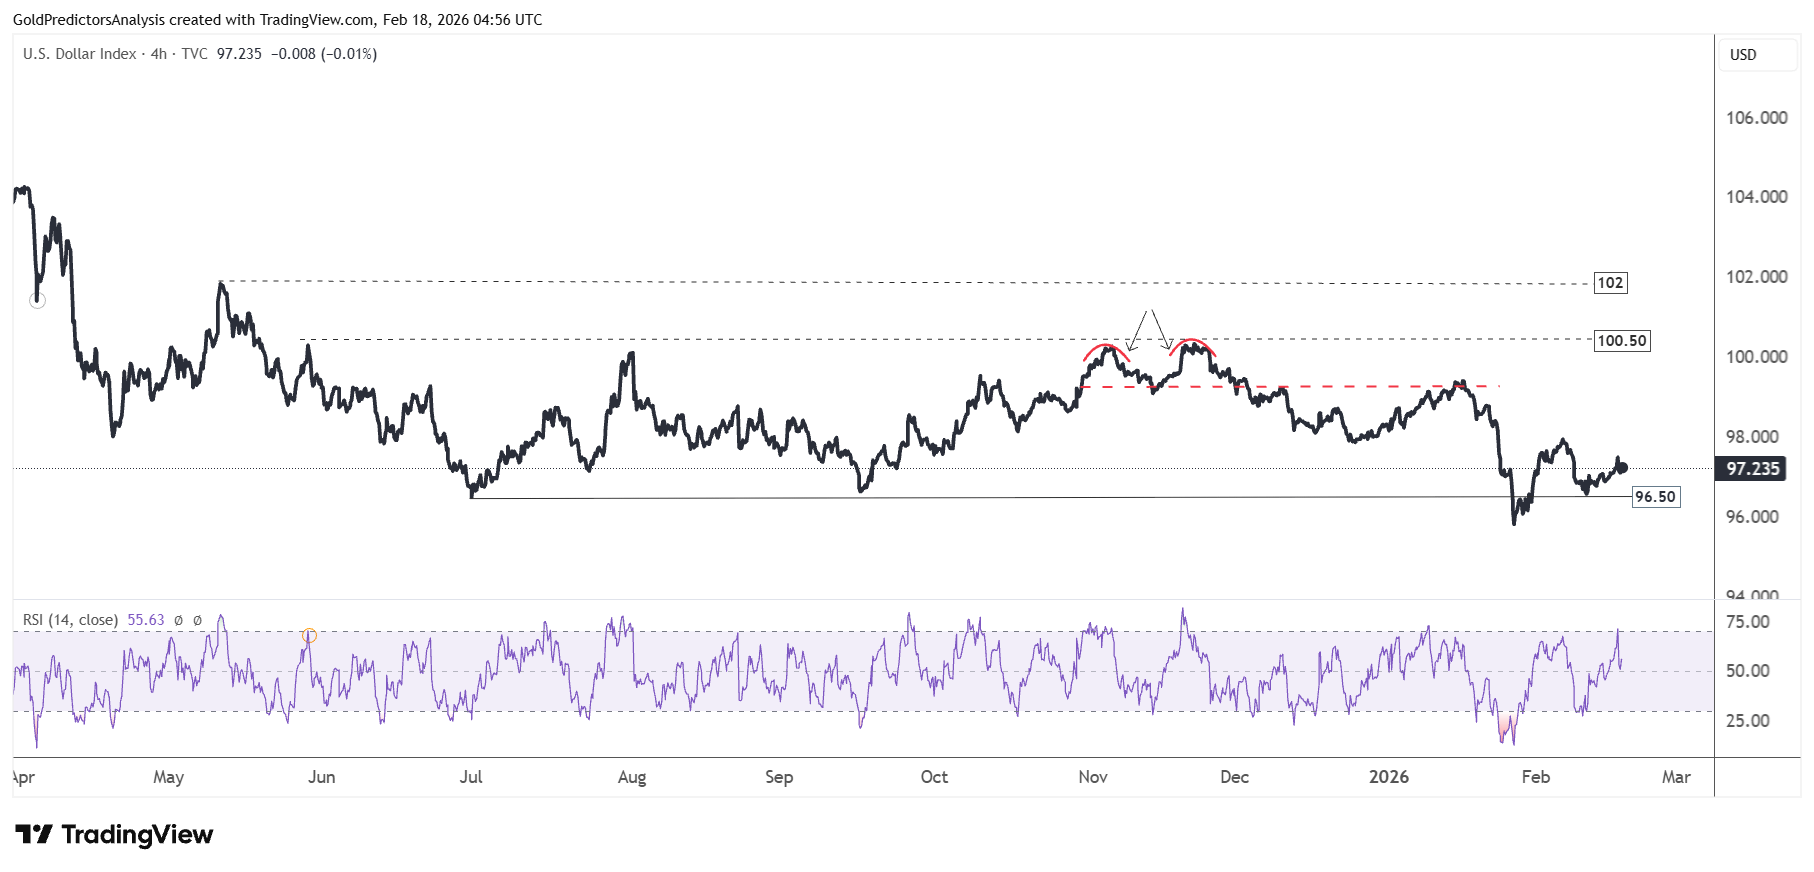
US Dollar 4-Hour – Consolidation
The 4-hour chart for the USD Index also shows price weakness, as the price is consolidating within the lower range of support. A break below the 96 level will take the index out of the 9-month consolidation in the USD Index.
Final Words
Gold remains strong above the key support levels and attracts buying interest ahead of the FOMC meeting minutes. The expectation of lower interest rates keeps the bullish tone in gold and silver. From technical perspective, the consolidation in gold below $5,100 increases the possibility of upside breakout.
On the other hand, the silver consolidation above $60- $70 supports the bullish trend. As long as $4,670 in gold and $50 in silver holds both metals will likely keep the bullish trend. A weaker U.S. dollar will be another boost for metals in the next sessions. Overall, the structure remains constructive with higher prices likely providing key support.