

Sui ($SUI ) is extending its downtrend for the second consecutive day, trading at 0.95 at the time of writing on Wednesday. The Layer-1 token is down over 16% in February and approximately 34% from the start of the year, aligning with the overall bearish sentiment across the crypto market.
Meanwhile, Sui appears at risk of extending its persistent decline, weighed down by low retail activity. Support at $0.87 is intact, but if broken, a retest of the demand zone at $0.79 could materialise.
Grayscale's Sui Staking ETF trading kicks off
Grayscale has announced the launch of the Sui staking Exchange-Traded Fund (ETF), with trading expected to start on Wednesday. The ETF has been listed on the New York Stock Exchange (NYSE) Arca under the symbol GSUI. The offering follows the official conversion of the former Grayscale Sui Trust, with the staking ETF expected to hold SUI tokens.
Grayscale stated that “while an investment in the shares is not a direct investment in SUI, the shares are designed to provide investors with a cost-effective and convenient way to gain investment exposure to SUI.”
The Bank of New York Mellon will serve as the Trust's transfer agent and administrator. Coinbase, Inc. will serve as the prime broker, and Coinbase Custody Trust Company will operate as the Trust's custodian.


Investors can only buy the Grayscale Sui Staking ETF in one or more blocks, each totaling 10,000 shares.
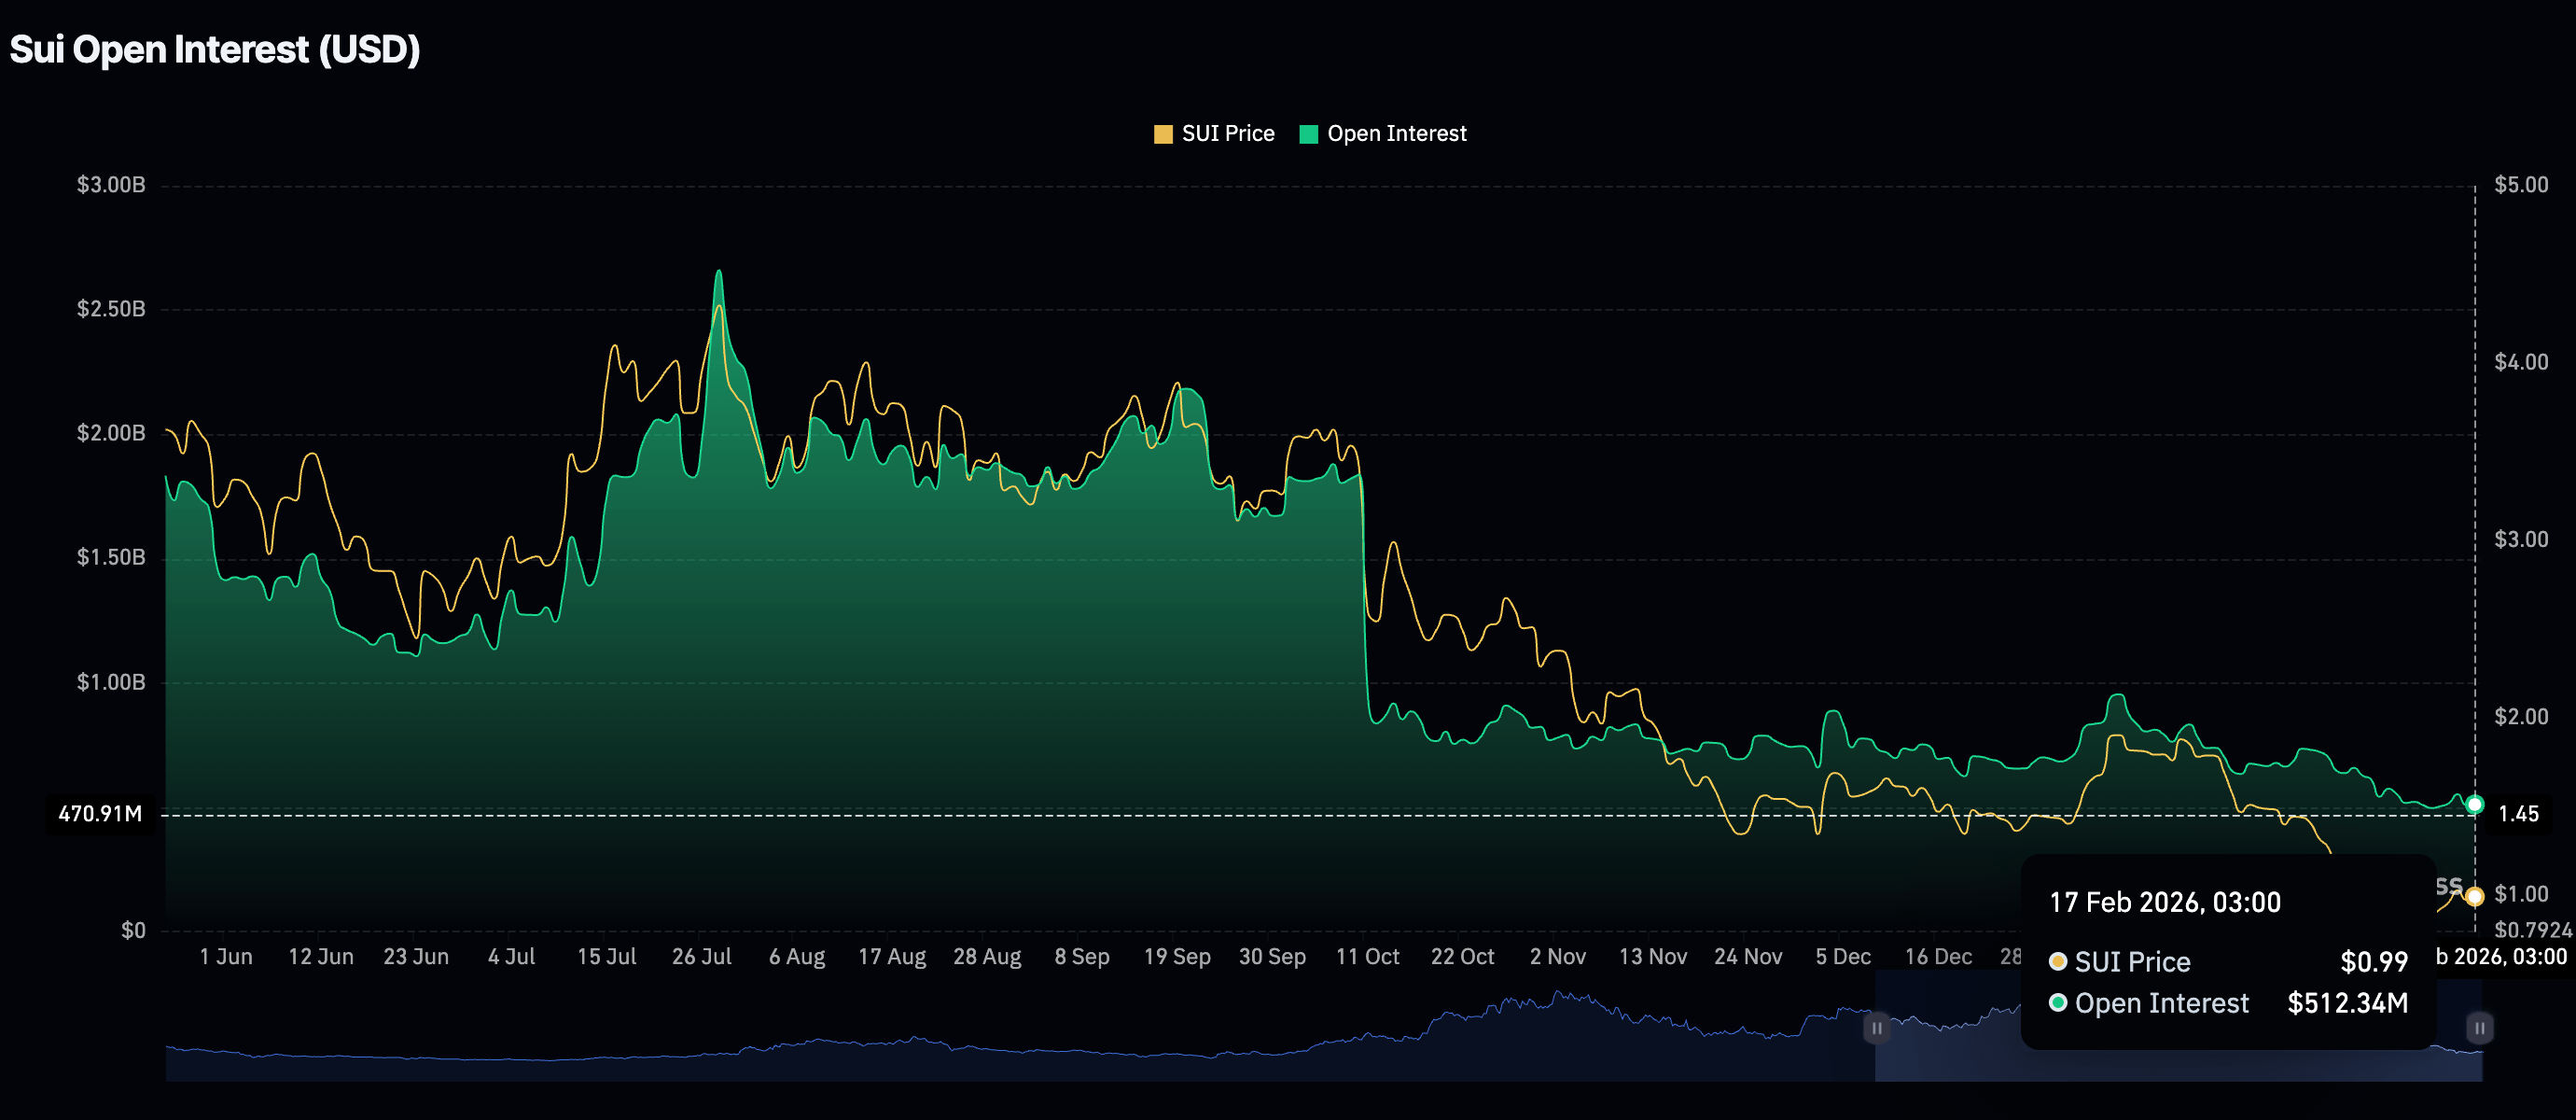
Despite the launch of the staking ETF, retail interest in Sui has remained significantly low, as evidenced by futures Open Interest (OI) falling to $512 million on Wednesday from $554 million on Sunday. Muted retail activity indicates that traders lack confidence in Sui’s ability to sustain an uptrend; hence, they are resolving to close positions rather than open new ones.
Technical outlook: Sui’s downtrend persists
Sui trades at $0.95 while holding below the downward-sloping 50-day Exponential Moving Average (EMA) at $1.28, preserving a bearish medium-term bias. The 100-day EMA at $1.58 and the 200-day EMA at $2.02 continue to descend, keeping rebounds contained.
At the same time, the Relative Strength Index (RSI) at 36 on the daily chart remains below 50, reinforcing a weak tone that could improve if buyers sustain traction. However, a continued decline in the RSI into oversold territory may accelerate Sui's downtrend to test the support at $0.78, aligning with the February 6 low.
Meanwhile, a close above descending trend resistance would open room toward the 100-day EMA at $1.58, while failure to build on the bounce would keep the broader downtrend dominant.
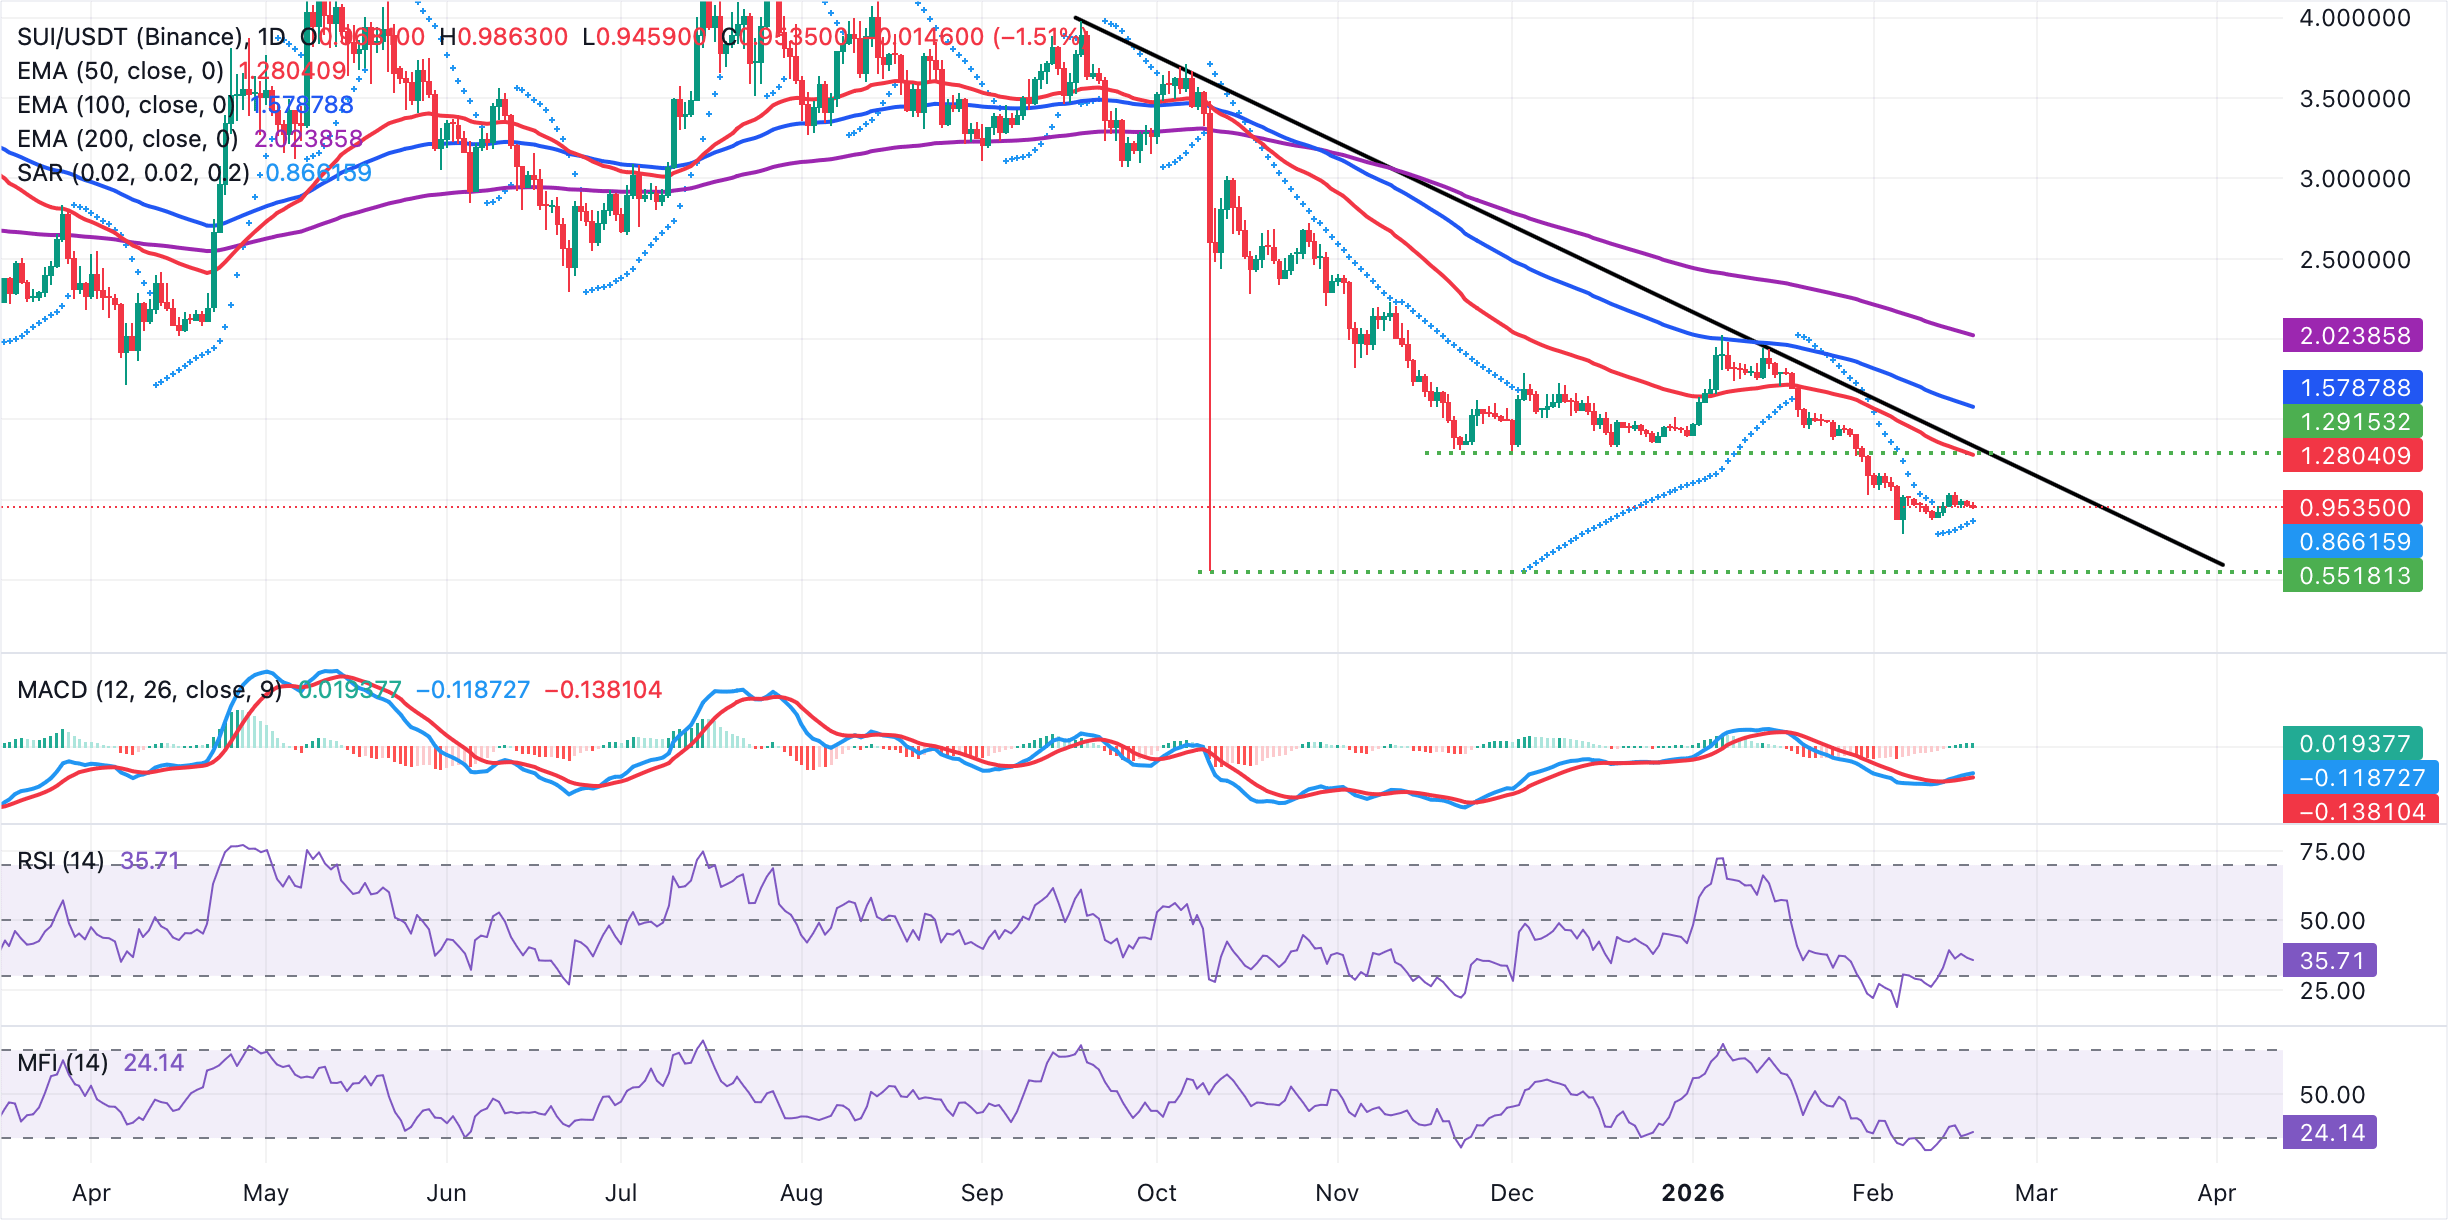
The Moving Average Convergence Divergence (MACD) histogram has turned positive and is modestly widening on the same chart, indicating the MACD line stands above the signal line near the zero mark and momentum is improving. Similarly, the Parabolic SAR at $0.86 sits beneath the price, underlining a tentative attempt at stability.