Bitcoin is attempting to break a historic losing streak. Since peaking at $126,000 in October 2025, $BTC has printed five consecutive red monthly candles a rare technical event seen only once before in its history. Currently hovering near $68,000, the market is at a critical psychological and technical juncture.
🔍 Technical Analysis: The Bounce vs. The Abyss
The monthly chart reveals a market searching for a floor:
• The Five Red Signal: Historically, a five month decline has been followed by significant relief rallies. Analysts note that the last time this occurred, it preceded a massive trend reversal.
• Critical Support: All eyes are on the $60,000 – $65,000 zone. A confirmed break below $60k could trigger a Wave C correction toward $52,000.
• Momentum Indicators: The RSI is hitting oversold levels comparable to the 2022 bottom, suggesting the selling pressure may be exhausted.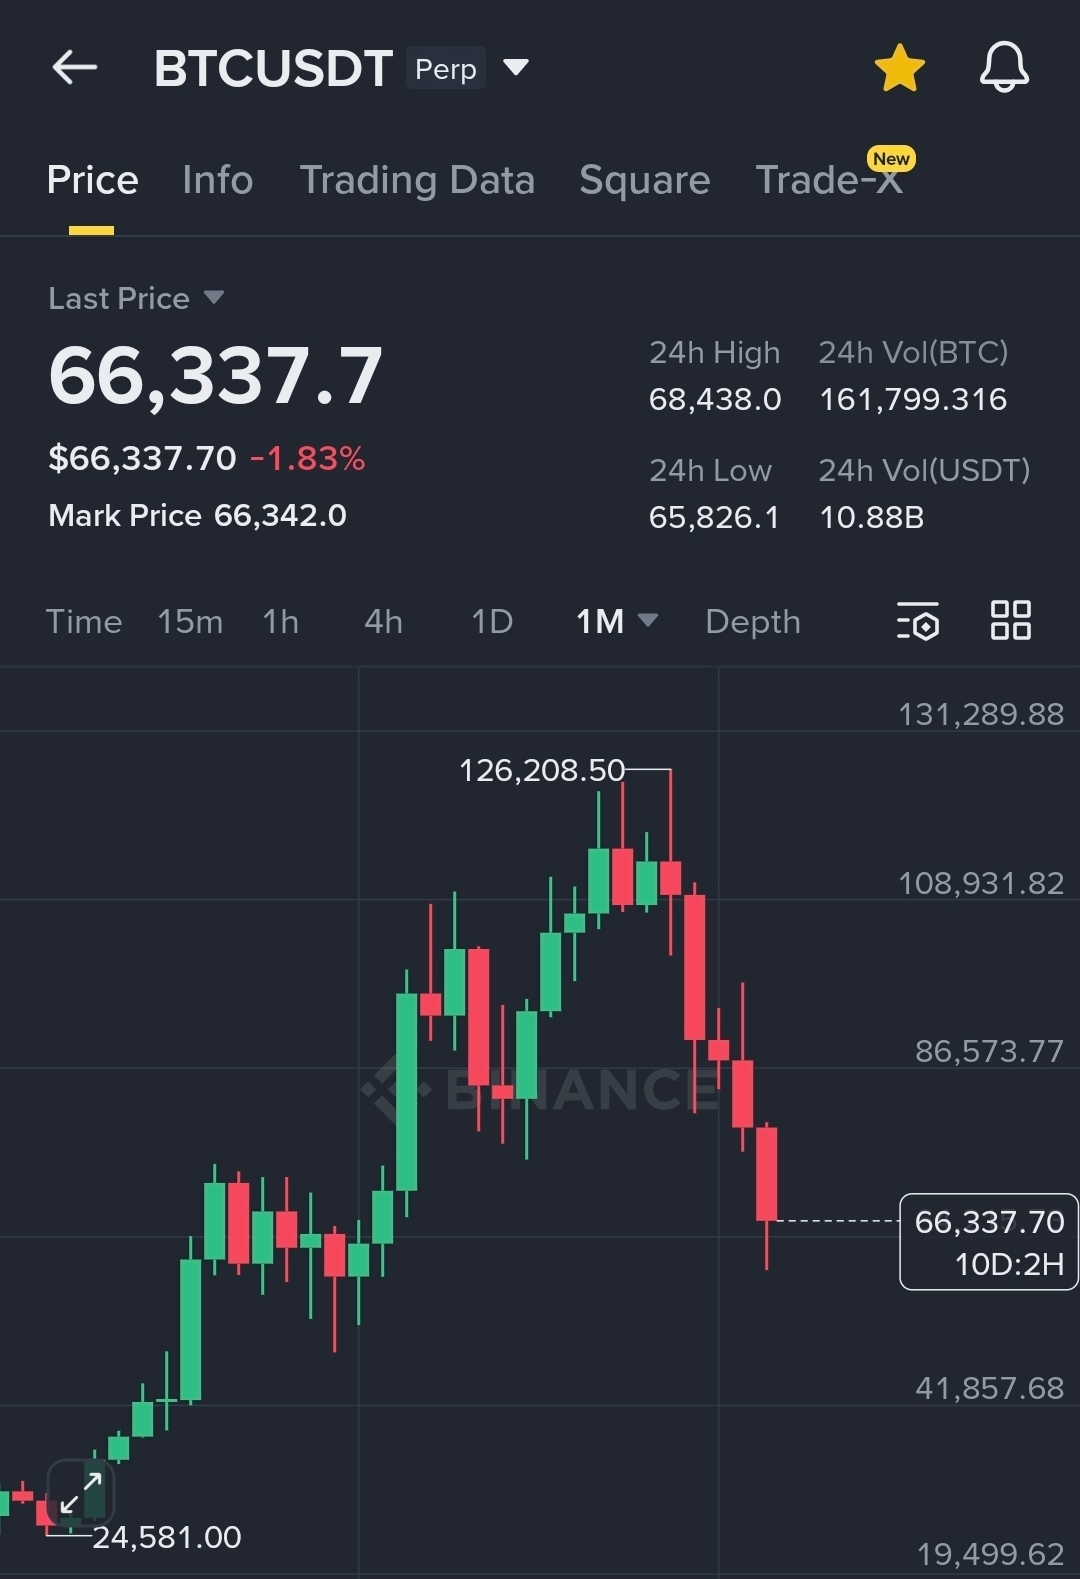
🏁 Professional Verdict
While February remains biased to the downside (currently down ~28% for the month), the emergence of bullish RSI divergence on shorter timeframes suggests we are closer to a meaningful bounce than most realize. A reclaim of $72,500 would be the first signal that the "Five-Red" curse has been broken.

Strategy: Watch the $60k floor. This isn't just a dip, it's a historical stress test.