

📊 BTC Technical Analysis Rising Trendline Defense and High-Probability Breakout Zone
Bitcoin is currently trading near 66,300 USDT on the 15-minute timeframe, positioned at a technically significant area where short-term direction is likely to be decided. The chart shows price reacting precisely from a rising trendline that has been respected multiple times over the past few sessions. This ascending structure indicates that buyers are gradually stepping in at higher levels, forming a constructive base after the recent pullback.
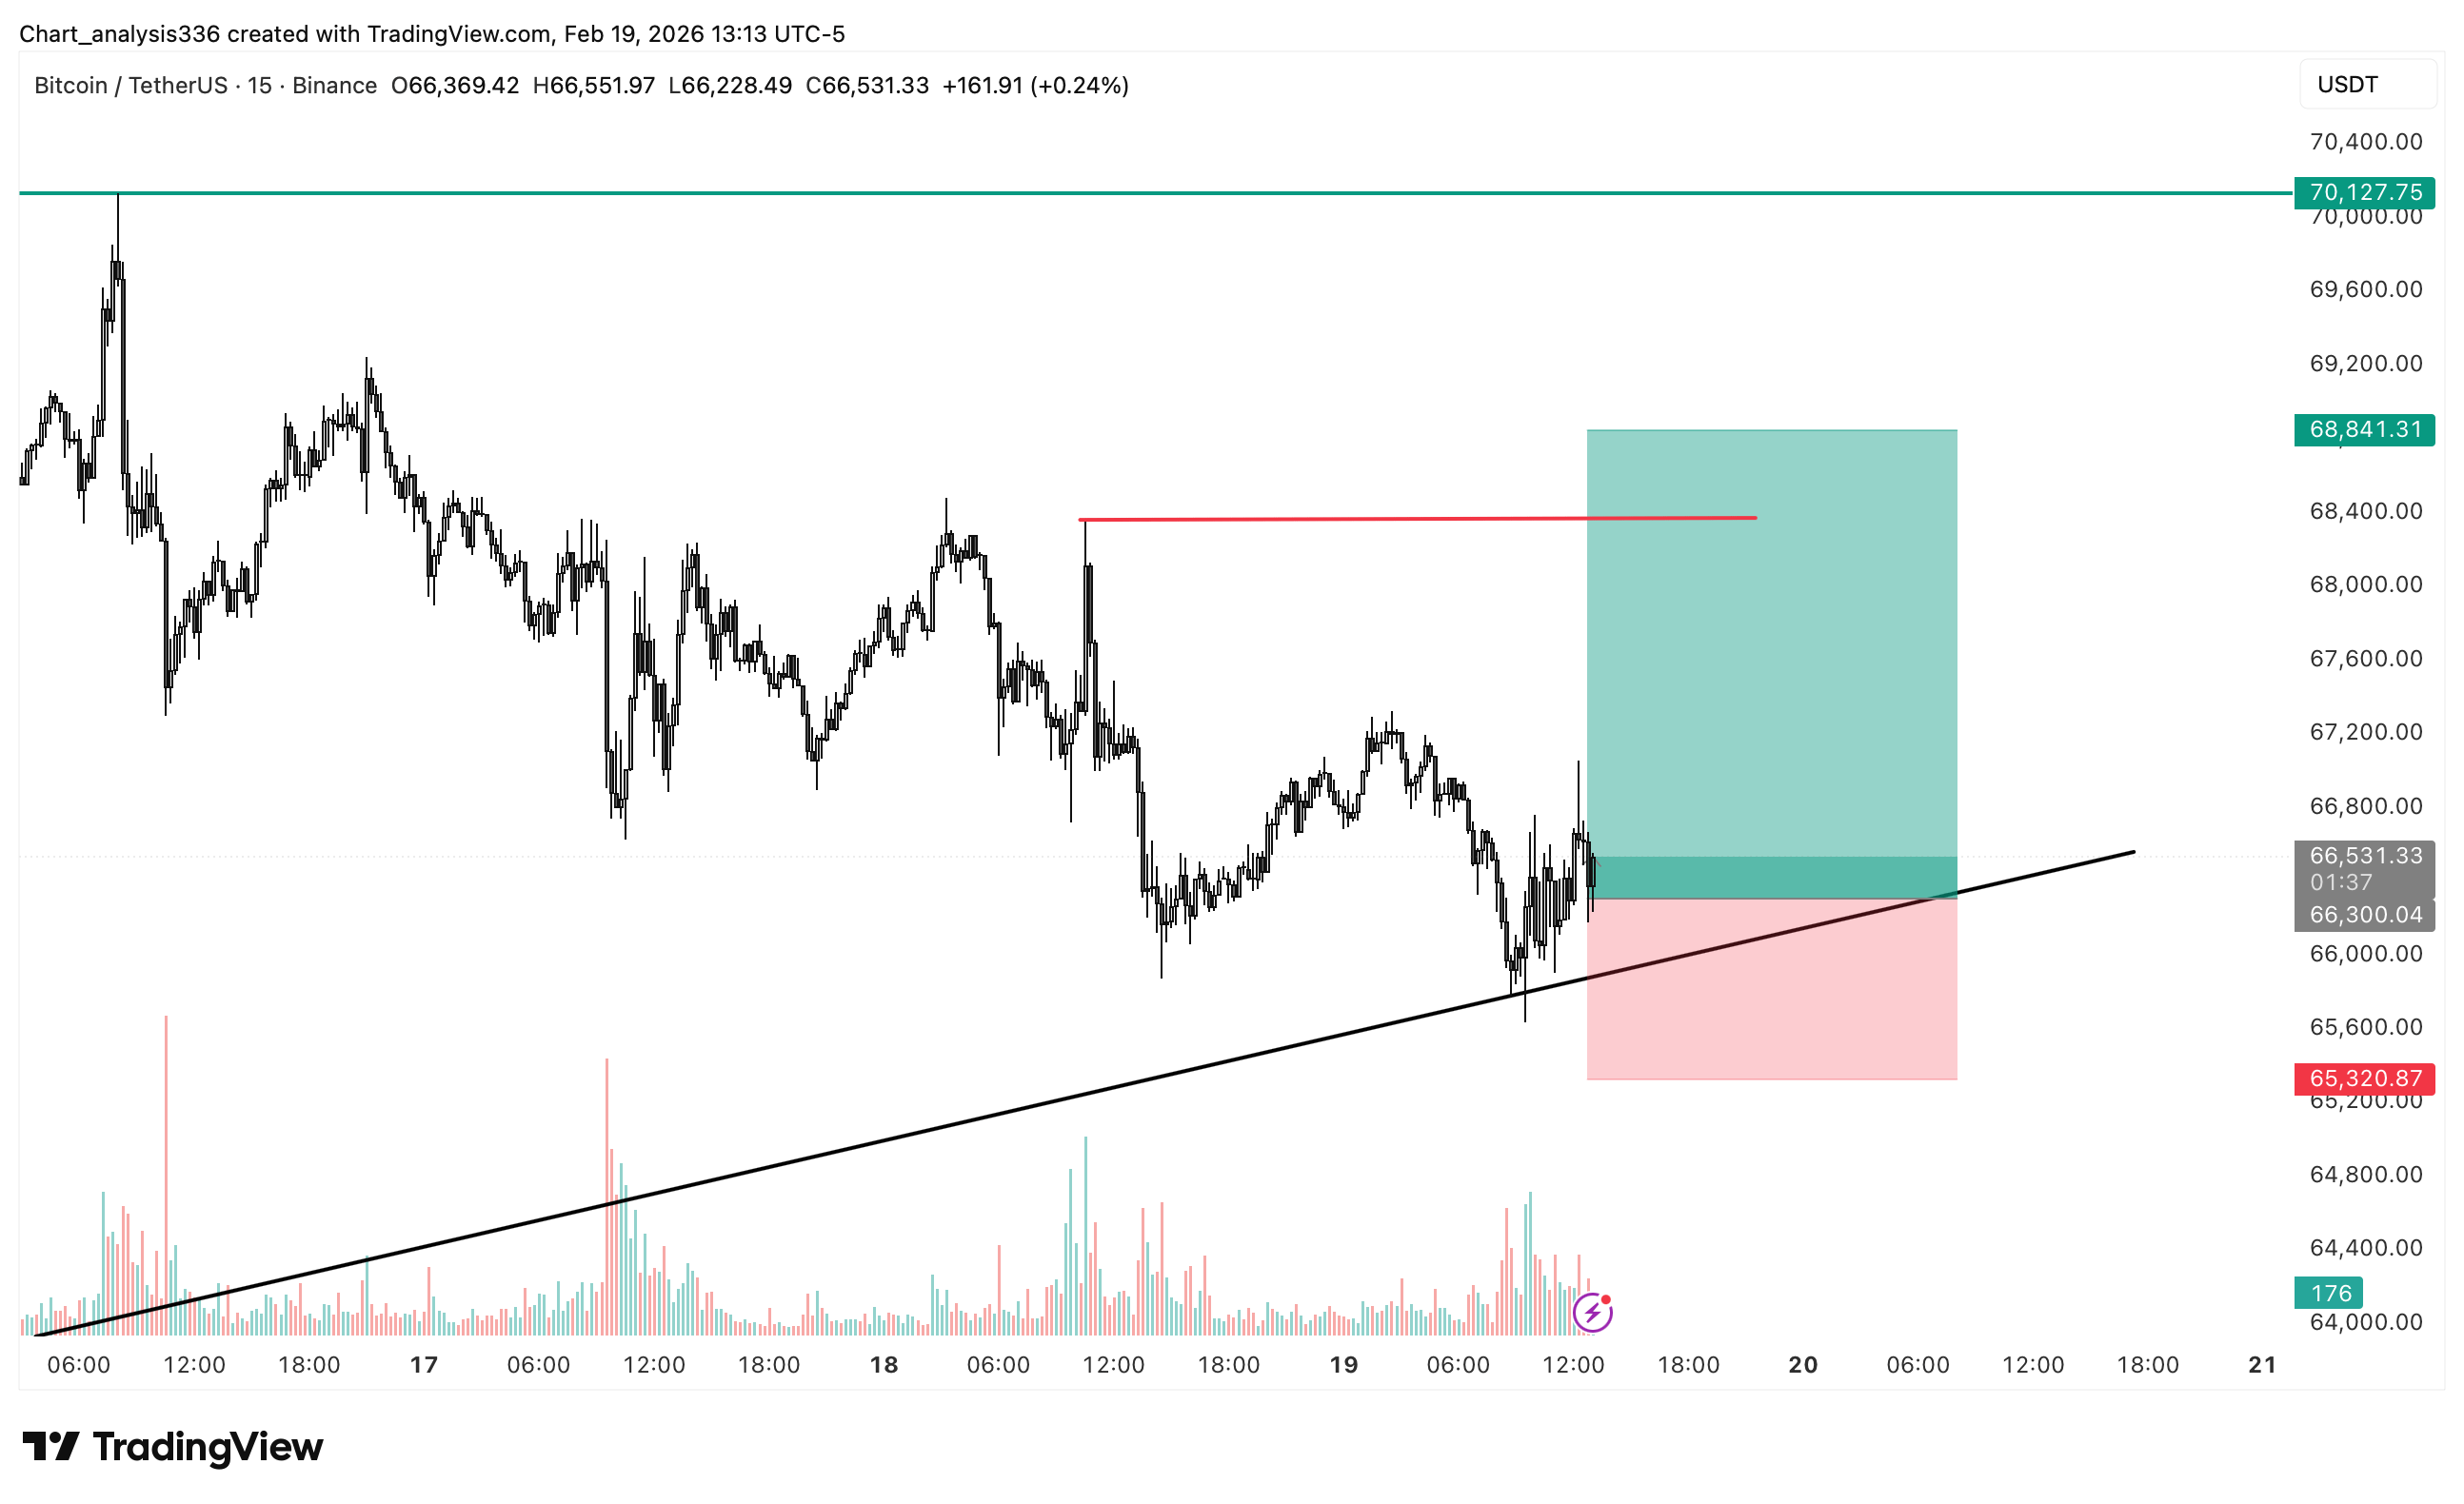
From a structural perspective, BTC experienced a sharp rejection earlier near the 68,300–68,500 resistance zone, marked clearly as a supply area. That rejection triggered a controlled correction rather than aggressive selling, which is an important detail. Instead of breaking down impulsively, price slowly drifted toward support and formed consolidation around the 65,800–66,000 region. This type of corrective behavior often suggests absorption of sell pressure rather than distribution.
The rising trendline visible on the chart represents dynamic support. Each time price approaches this level, buying interest increases, preventing deeper breakdowns. This indicates that short-term participants are defending the bullish structure. As long as BTC continues to respect this trendline, the probability of a relief move toward resistance remains elevated.
Volume analysis further supports this observation. Increased volume spikes appeared during the recent bounce from the support zone, signaling active participation from buyers. When rising volume aligns with higher lows, it often reflects accumulation. However, upside confirmation still requires a decisive breakout above the near-term resistance cluster.
The immediate resistance area lies between 67,200 and 67,500, followed by the major supply zone at 68,300–68,500. A clean break and sustained close above 67,500 would confirm bullish continuation and likely open the path toward retesting 68,500 and potentially expanding toward the higher liquidity region near 69,000+. Conversely, repeated failure below this resistance band may extend consolidation.
On the downside, the most critical invalidation level remains 65,300. A breakdown below this level would not only violate the ascending trendline but also shift short-term structure into a bearish sequence of lower lows. In that scenario, price could rotate toward deeper support zones around 64,800–64,000. Therefore, this level is essential for maintaining bullish bias.
Market psychology at this stage suggests compression. Price is trading in a tightening range between rising support and horizontal resistance. Such compression typically precedes volatility expansion. Traders should expect a stronger directional move once this range resolves.
In summary, $BTC is currently in a decision phase with a slight bullish bias as long as the rising trendline holds. The structure favors upside continuation toward 68,000+ if resistance levels are cleared with strong volume. However, risk remains elevated below 65,300. Patience, confirmation, and disciplined risk management are crucial in this environment where false breakouts are common before the real move begins.
#BTCRising
