As of the latest trading session, the OPEN/USDC pair is exhibiting a intriguing mix of bullish momentum and technical resistance. Currently changing hands at $0.15633, the asset has posted a solid +3.30% gain, signaling renewed interest from buyers. However, a closer look at the charts and key indicators suggests that while the momentum is positive, the market is approaching a critical decision point.
Price Action and Key Levels
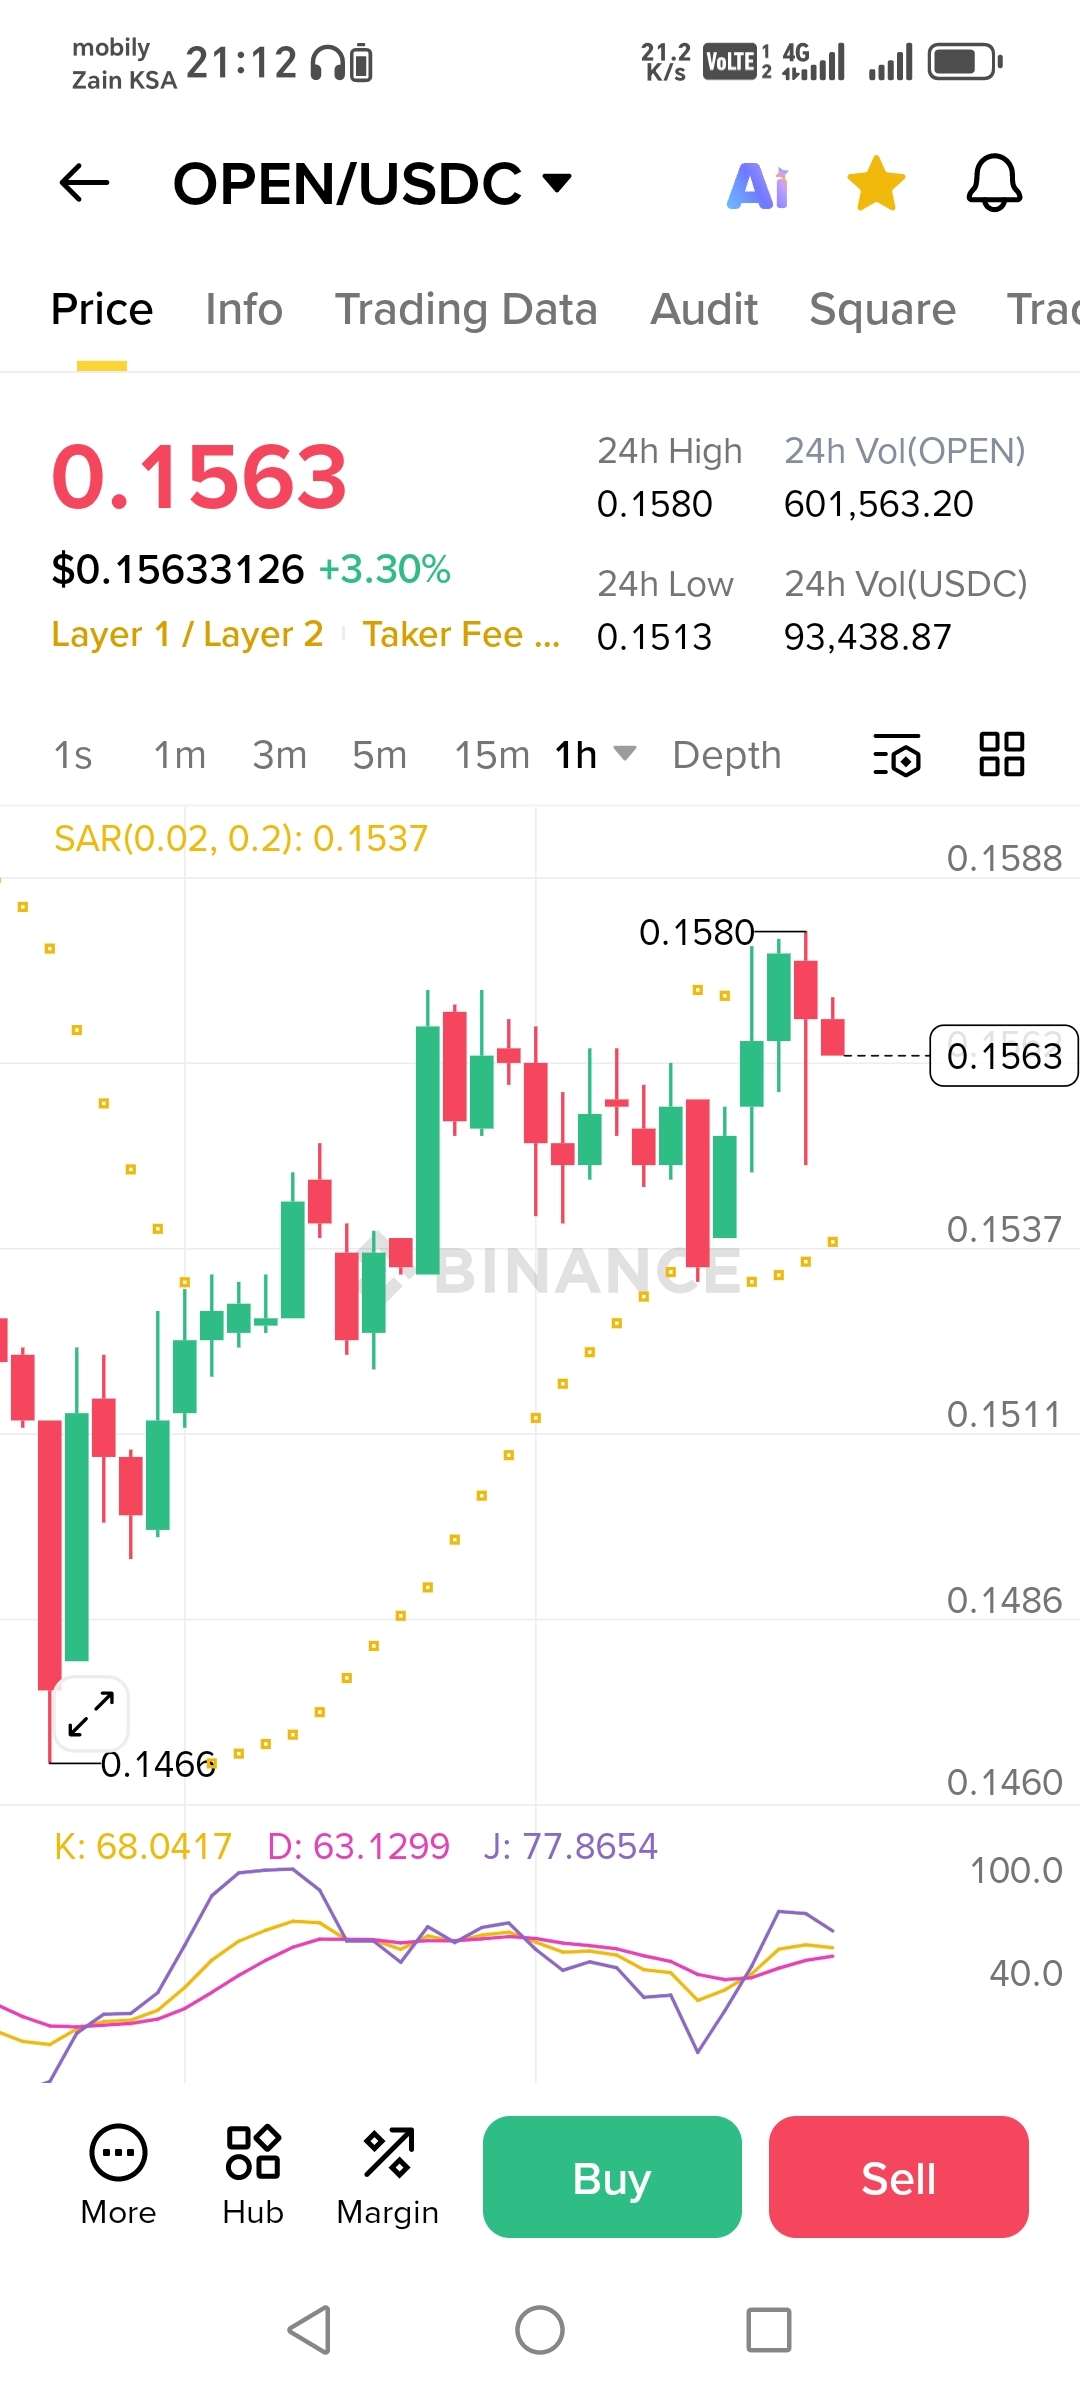
The daily trading range tells a story of a market that has woken from a period of consolidation. After hitting a low of $0.1513**, buyers stepped in aggressively to push the price toward the current session high of **$0.1580. This move represents a clean sweep of the upper range, and the fact that OPEN is holding near the top of this range suggests underlying strength.
The visual price ladder on the chart highlights the immediate battleground. The price of $0.1563 sits just above the SAR (Parabolic Stop and Reverse) indicator line, which is resting at 0.1537. For traders using the SAR, the fact that the price is above the dotted lines is a classic bullish signal. It implies that the trend is intact and that the recent upward move has enough traction to potentially continue. However, the "More, Hub, Margin" interface suggests this is a dynamic trading environment where leverage might be in play, increasing volatility.
Volume and Momentum
The 24-hour volume figures provide crucial context for this rally. With 601,563.20 OPEN traded and a corresponding **$93,438.87 USDC** volume, the move is backed by decent participation. It is not an explosive breakout on massive volume, but it is sufficient to support the current trend. Traders will be watching to see if volume picks up if the price attempts to breach the $0.1580 resistance level. A failure to break through on higher volume could indicate a weakening of the buying pressure.
The Stochastic Oscillator (K: 68.04, D: 63.13, J: 77.86) is currently sending a nuanced message. The values are in the upper half of the range, confirming the bullish momentum. However, they are entering the overbought territory (typically above 80). The "J" line, a more sensitive line, is already at 77.86. This indicates that while the bulls are in control, the move is becoming stretched. A potential crossover of the K line below the D line in the near future could signal that the momentum is stalling, leading to a short-term pullback or consolidation.
The SAR and Market Context
The Parabolic SAR value of 0.1537 is currently the most important support level to watch. As long as the price remains above this point, the trend is considered bullish. A break below the SAR would be the first technical sign that the rally is losing steam. The SAR acts as a trailing stop-loss for trend followers; therefore, a cluster of stops might sit just below this level.
The market structure, being labeled as Layer 1 / Layer 2, adds an element of fundamental interest. This indicates that the asset is tied to infrastructure technology, which often sees volatile price swings based on network upgrades or adoption news.
Conclusion
OPEN/USDC is currently in a favorable position, trading higher with the Parabolic SAR supporting the uptrend. The immediate hurdle is the 24-hour high of $0.1580**. A clean break above this, ideally with increased volume, could open the door to test the next psychological level near **$0.1588.
However, caution is warranted. The Stochastic Oscillator warns that the rally is mature. Traders should watch for a potential pullback toward the $0.1537 (SAR) level. For now, the path of least resistance is upward, but the risk of a short-term correction is rising as bulls attempt to hold their ground near the session's peak.