As of Sunday, February 22, 2026, the BNB/USDT market is showing signs of a short-term pullback following a period of volatility.
Momentum: BNB has been sliding toward support as leverage in the market unwinds. If it fails to hold the $592 level, analysts suggest it could drop further toward the early February low of $574.
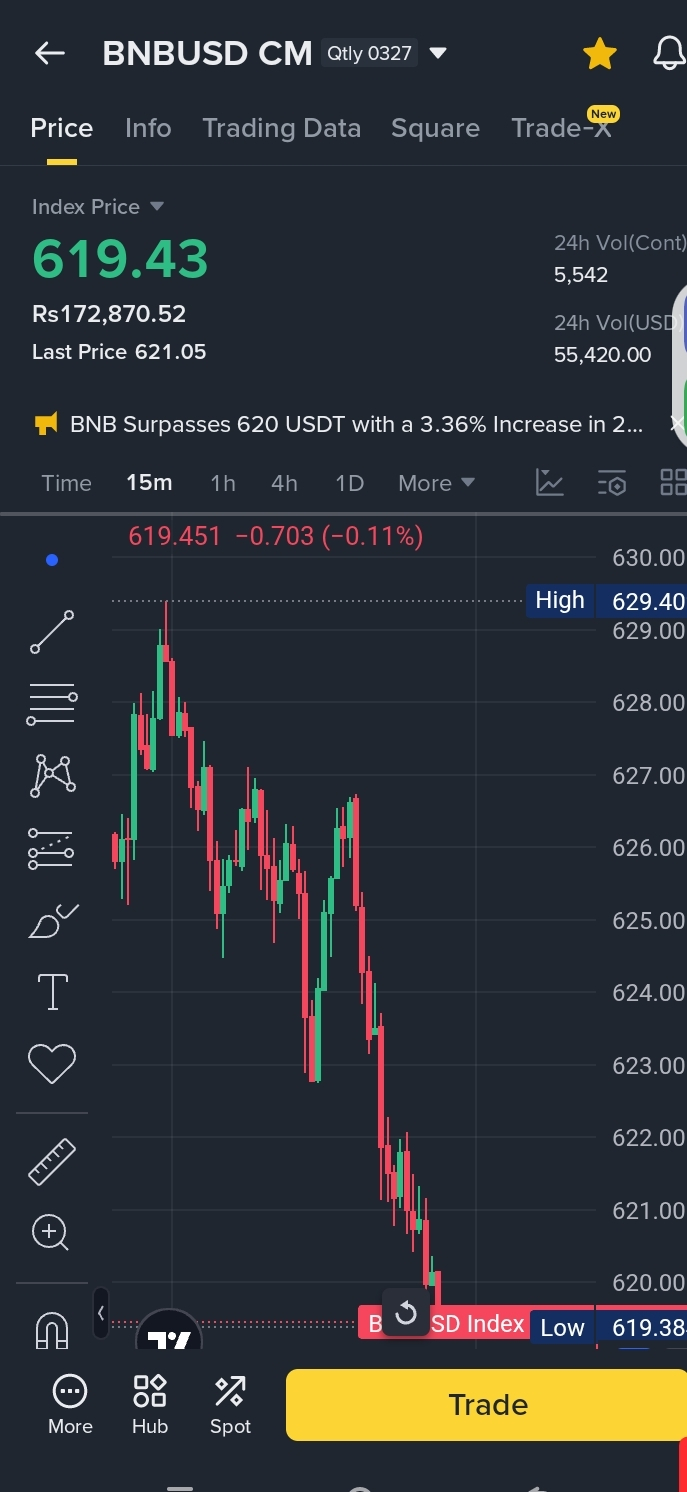
Technical Indicators: The 200-day moving average is currently acting as resistance, and recent price action shows "lower highs," which often signals continued selling pressure.
The "Buy" Case (Bullish)
Support Bounce: If you are a long-term buyer, the current dip into the $610–$620 range is being viewed by some as a "re-entry zone."
Confirmation: For a safer "buy" entry, traders are looking for a daily close above $641.70. Breaking this level would flip the short-term trend back to bullish.
Short-term: Use caution. The trend is currently leaning bearish until it clears $642.
Long-term: Indicators suggest BNB remains a strong altcoin, and current price levels are significantly lower than the $900+ peaks seen earlier in the year.Would you like me to set a price alert for you or analyze a specific technical indicator like the RSI?