Alright team, let's break down this juicy $BTC chart and see what's cooking on the daily timeframe!
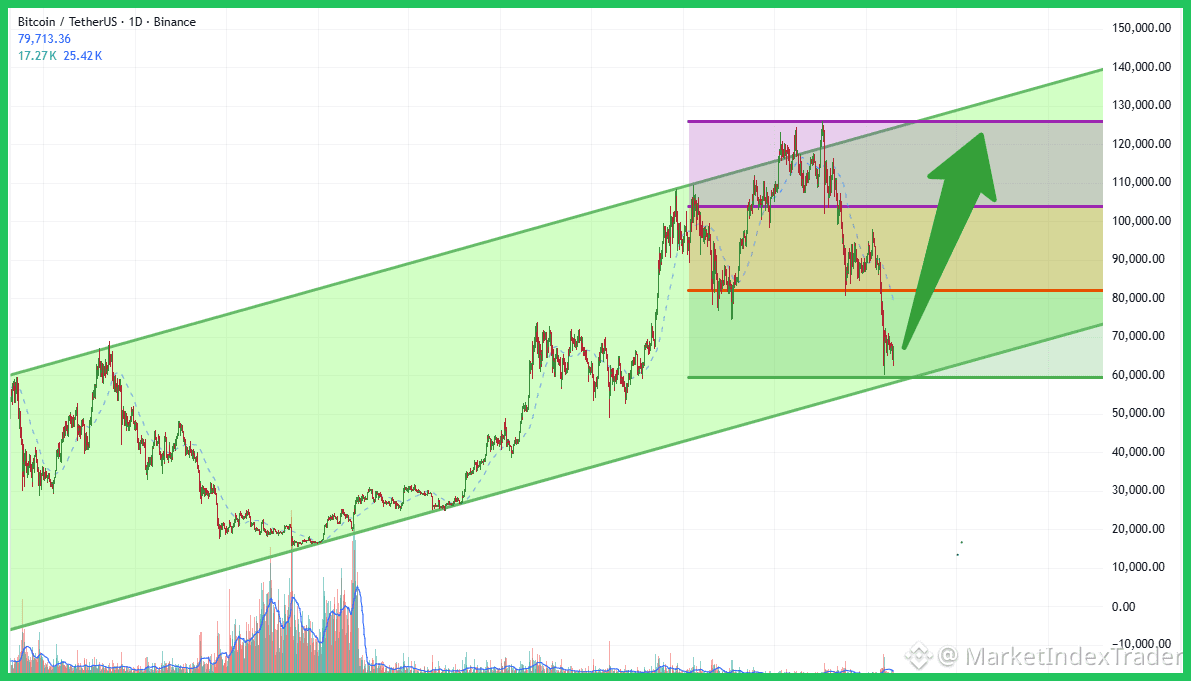
We're looking at the BTC/USDT 1D chart, and what stands out is the clear, long-term bullish channel Bitcoin has been trading within. After a significant run-up, price has retraced precisely to the lower boundary of this channel, which historically has served as robust support. This critical support zone sits roughly between $60,000 and $65,000. Immediate resistance levels to watch are around $82,000 (previous support) and then $105,000. This current retest of the channel's base is a pivotal moment.
On the fundamental side, Bitcoin's narrative remains incredibly strong. The recent Halving event is historically a bullish catalyst, while spot BTC ETFs continue to attract significant institutional capital, signaling growing mainstream adoption. These factors provide a powerful tailwind.
From my perspective, this looks like a prime accumulation zone for long-term conviction. The confluence of strong technical support and positive fundamentals presents an exciting opportunity for patient investors. Watch for clear signs of bullish momentum to confirm the bounce.
Highly recommend HOLD and Stacking $BTC at Binance.
Feel free to comment the altcoin you are holding and we will check it for you!
#BTC #Bitcoin #TechnicalAnalysis #Crypto #BinanceSquare #Halving #BTCHalving