

When I look at BNB around the $880–$890 zone, what stands out isn’t excitement — it’s stability. After several volatile cycles across the broader market, BNB appears to be regaining footing rather than chasing momentum. That distinction matters.
At roughly $883, price action suggests buyers are stepping back in, but selectively. This isn’t an aggressive breakout environment. It’s more controlled, almost deliberate, as if the market is testing whether demand can sustain itself rather than spike and fade.
Short-Term Structure: Where the Market Is Deciding
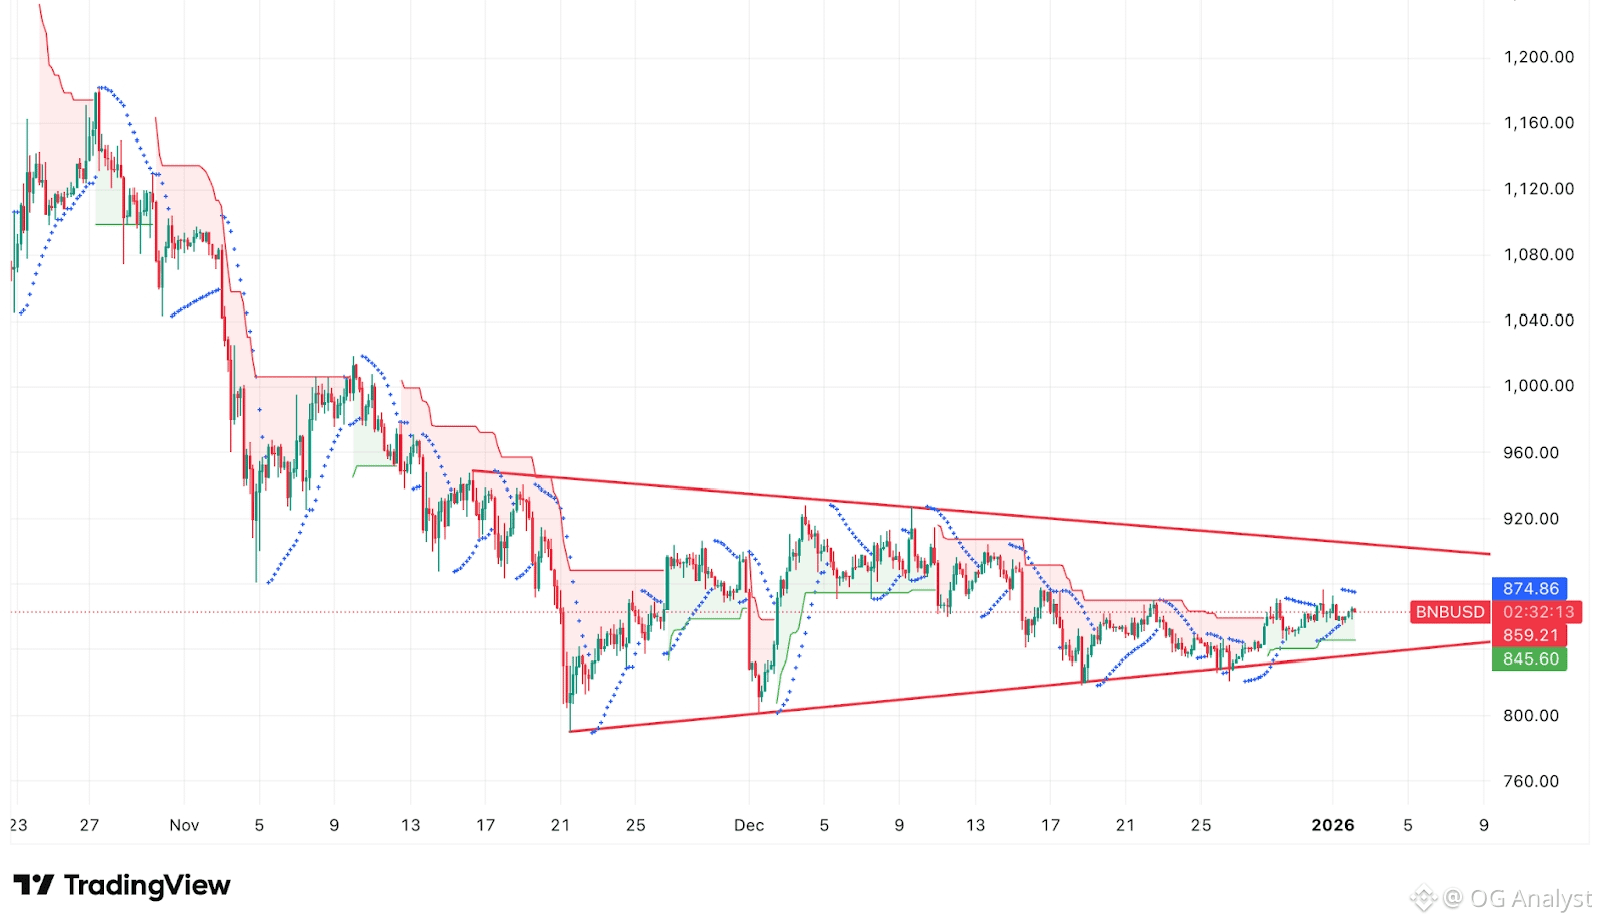
From a technical perspective, BNB has recovered from the $865 region, which now acts as a meaningful reference point. That level did its job — it attracted buyers without triggering panic selling beforehand.
The immediate challenge sits higher, around $890–$891. If price acceptance develops above that area, continuation becomes possible. If not, the structure below remains well-defined, with $855 acting as the first area where buyers are likely to reassess.
What I find important here is symmetry. Upside and downside levels are clearly mapped, which often signals a market that’s waiting for confirmation rather than reacting emotionally.
Momentum Indicators Tell a Measured Story
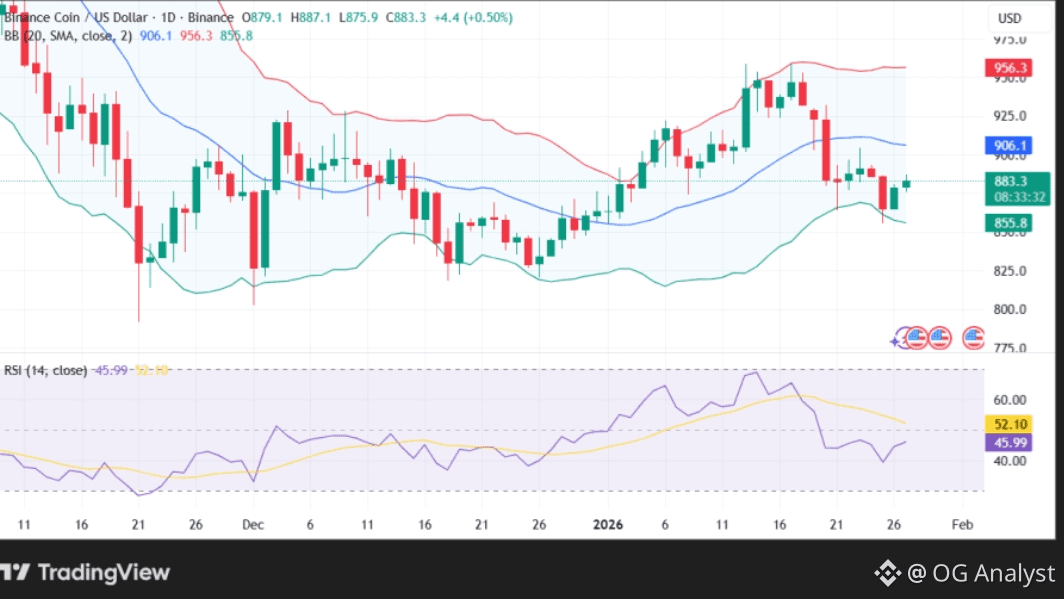
Momentum indicators aren’t flashing extremes. RSI remains in neutral territory, gradually rising rather than spiking. That usually reflects steady accumulation, not speculative excess.
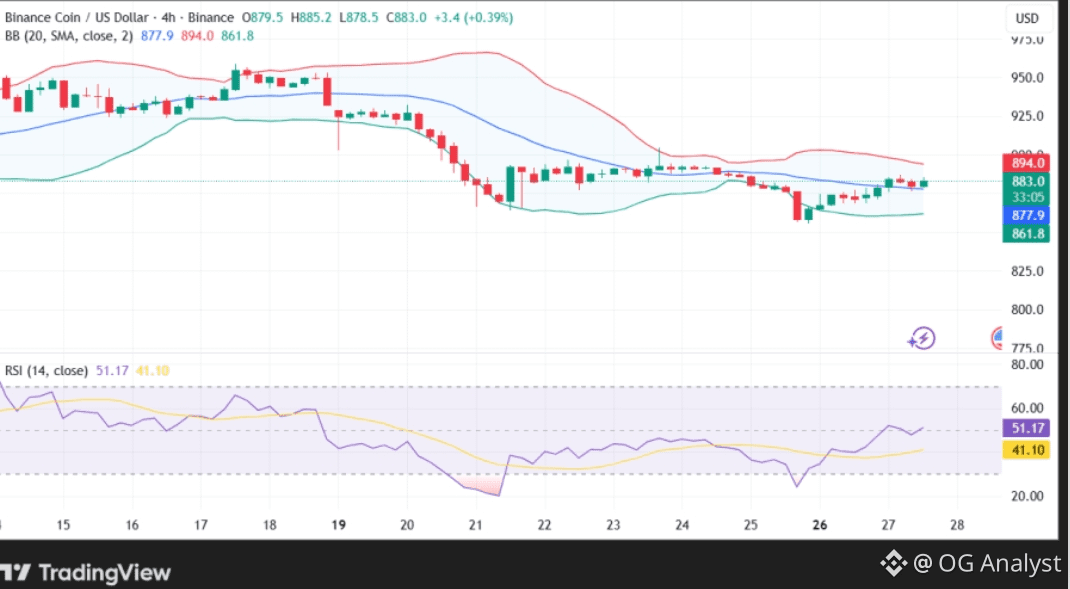
Volatility has increased slightly on the daily timeframe, but it’s far from disorderly. On shorter timeframes, volatility actually compresses — suggesting consolidation, not exhaustion.
In simple terms: buying pressure exists, but it’s controlled.
Moving Averages: Mixed, but Improving
When I step through the moving averages, the picture is mixed — and that’s not a bad thing.
Shorter-term averages are beginning to flatten, while longer-term averages still hover overhead. This often happens during transitions, when price is deciding whether it can reclaim higher ground or remain range-bound.
What matters more than the signals themselves is their convergence. BNB isn’t stretched far from its averages, which reduces the risk of sharp mean reversion moves.
Why BNB Is Holding Up Better Than Many Expect
BNB’s resilience isn’t accidental. Its utility remains deeply tied to ecosystem mechanics — from fee efficiency to recurring token burns that steadily reduce circulating supply.
That doesn’t guarantee price appreciation, but it does create structural demand that behaves differently from purely narrative-driven assets. In uncertain markets, that kind of embedded utility often helps explain why price doesn’t unravel as quickly.
To me, this is less about optimism and more about function.
Thinking About the Long Term Without Overpromising
Long-term projections for BNB vary widely, and I’m cautious about treating any number as a destination. What feels more grounded is the trajectory: gradual expansion of use cases, periodic supply reduction, and consistent integration into a broader on-chain economy.
If those elements continue to compound, higher valuations become plausible over time — not because of speculation, but because of sustained relevance.
That said, no projection replaces independent analysis. Price models are tools, not conclusions.
Key Levels I’m Personally Watching
Immediate resistance: $890–$891
Near-term support: $865
Structural support: $855
As long as BNB continues to respect this range without sharp invalidation, the market remains constructive — not euphoric, not fearful.
Closing Reflection: A Market in Assessment Mode
BNB right now feels like an asset being evaluated, not chased. Buyers are present, but they’re disciplined. Sellers exist, but they’re not pressing aggressively.
That balance tells me more than any prediction headline ever could.
For now, BNB isn’t making promises. It’s simply holding its ground — and in this market, that’s a signal worth paying attention to.
