

Dogecoin price faces resistance at the lower bound of the broken trend line.
Santiment data shows that some whales have accumulated Dogecoin at recent dips, indicating a relief in selling pressure.
Technical indicators suggest a short-term recovery, as bearish momentum fades.
The price of Dogecoin ($DOGE ) is trading in the red, hovering around $0.095 at the time of writing this report on Monday, after declining more than 7% in the previous week. On-chain data shows that some whales have accumulated Dogecoin at recent dips, indicating a relief in selling pressure and a signal for price stabilization in the short term. Technical forecasts show that weakness in momentum indicators is fading, suggesting a potential recovery if Dogecoin rises again above the lower trend line resistance.
Dogecoin whales are buying 250 million tokens.
Supply distribution data from Santiment supports a positive outlook for Dogecoin, as some whales are buying the dog-themed meme coin at recent price dips.
The metric indicates that whales holding between 100,000 and 1 million (red line) and 10 million and 100 million (blue line) Dogecoin tokens have accumulated a total of 250 million Dogecoin tokens since Thursday. During the same period, whales holding between 1 million and 10 million (yellow line) disposed of 110 million tokens. This shows that the first group of whales seized the opportunity and collected Dogecoin at a discounted price.
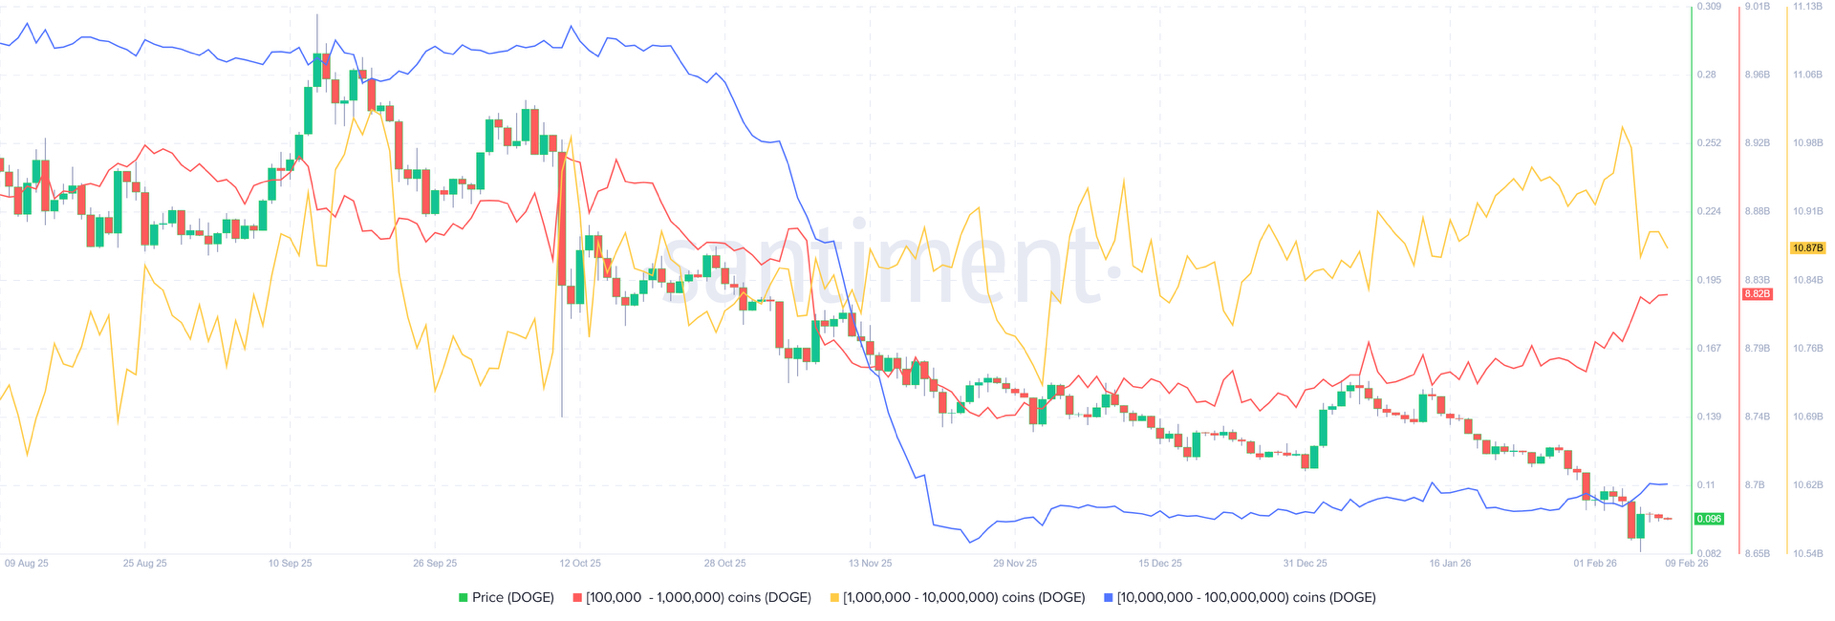
A chart of Dogecoin supply distribution. Source: Santiment.
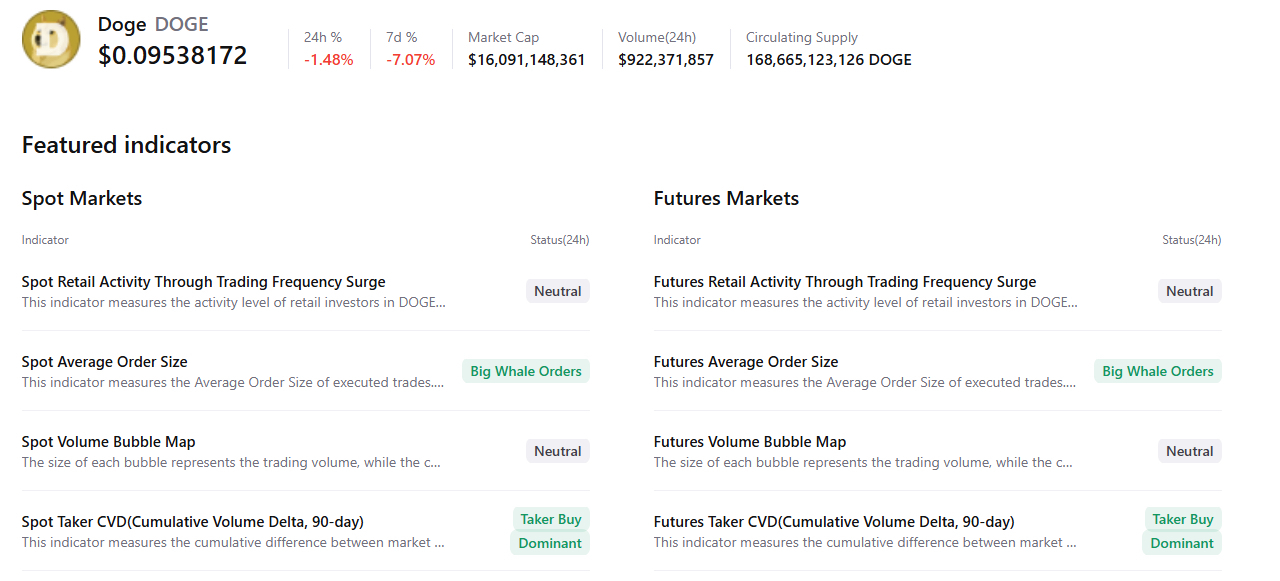
Data from CryptoQuant's summary supports the positive outlook, showing significant whale orders and buying dominance in the Dogecoin spot and futures markets, indicating a potential recovery ahead.
Dogecoin price prediction: Dogecoin revisits the minimum of the descending wedge pattern.
The price dropped by more than 7% last week, reaching a low of $0.080, above the weekly support at $0.078, before bouncing back on Friday to retest the previously broken trend line. Dogecoin faced resistance around this line over the weekend. At the time of writing this report on Monday, Dogecoin is trading at $0.095.
If Dogecoin breaks and closes above this line on a daily basis, it may extend the recovery towards the February high at $0.110.
Traders should be cautious as the main trend of Dogecoin remains bearish, so any short-term recovery has a high likelihood of being a temporary rebound — a short price increase within a broader downward trend.
The Relative Strength Index (RSI) reads 32, bouncing from the oversold area and indicating waning bearish momentum. However, the bears are still in control, as the RSI needs to move above the neutral level of 50 for the price recovery to continue. The Moving Average Convergence Divergence (MACD) lines are converging, with red histogram bars fading below the neutral level, indicating diminishing bearish strength.
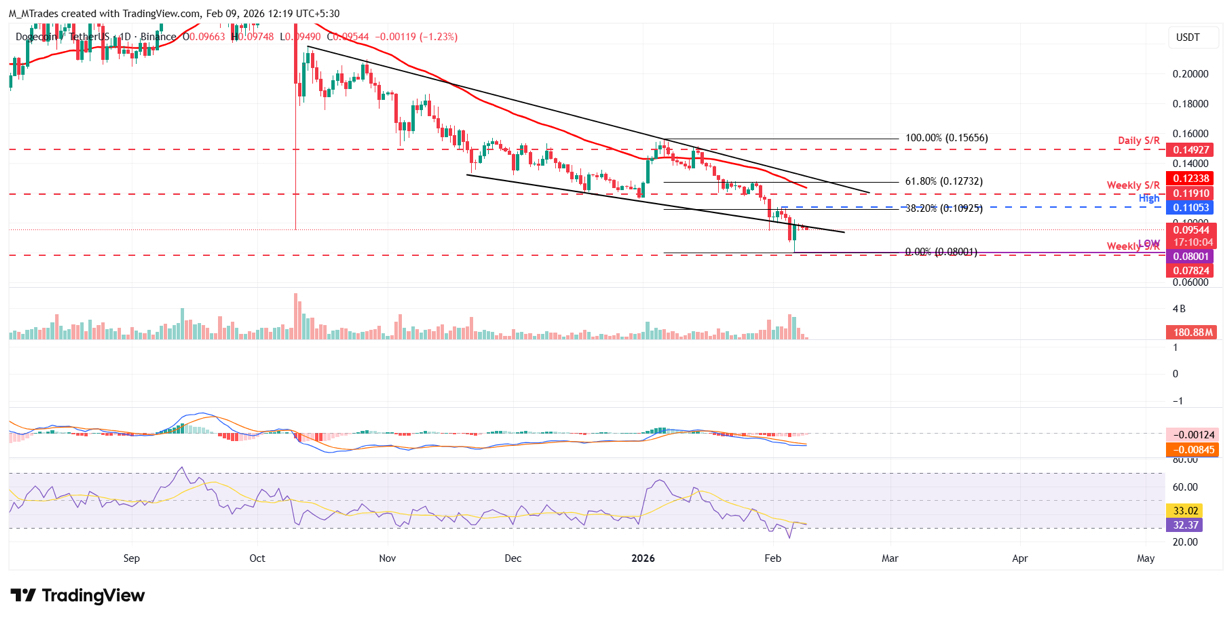
Daily chart of Dogecoin/Tether.
If it resumes its continued downward trend, it may drop towards Friday's low at $0.080. Closing below this level could extend losses towards the next weekly support at $0.078.
#Dogecoin #doge⚡ #BinanceSquareFamily #BinanceSquare #BinanceSquareTalks