⚠️ DISCLAIMER.
Everything written below is not financial advice. I'm just sharing my experiences and observations. Candle analysis does not provide 100% guarantees, but it significantly increases the likelihood of success. The decisions are made solely by you. Now, let's get to the point 👇
Do you know the difference between those who look at the chart for 5 years and those who just joined yesterday? The former see entire stories in the candles. The latter just see green and red sticks. Candles are the language of the market. If you understand it, you hear what smart money is whispering.
Today we will analyze:
✅ What a candle consists of
✅ 5 most powerful patterns
✅ Where to look for entries
✅ How to avoid false signals
Let's go 👇
1️⃣ CANDLE ANATOMY
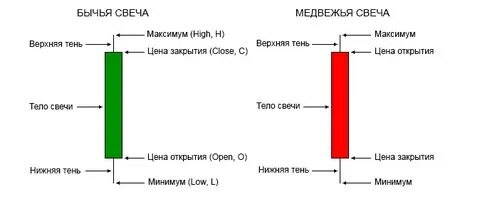
Before reading, you need to know the letters. Each candle tells the story of one period (5 minutes, 1 hour, 1 day):
🟢 Body - the difference between opening and closing
🟢 Upper shadow (wick) - maximum price for the period
🟢 Lower shadow - minimum price for the period
Long body - confidence. Long shadows - struggle. Small body - indecision. Remember this, and the charts will speak.
2️⃣ PATTERN №1: PIN-BAR (PIN TARGET) 📍
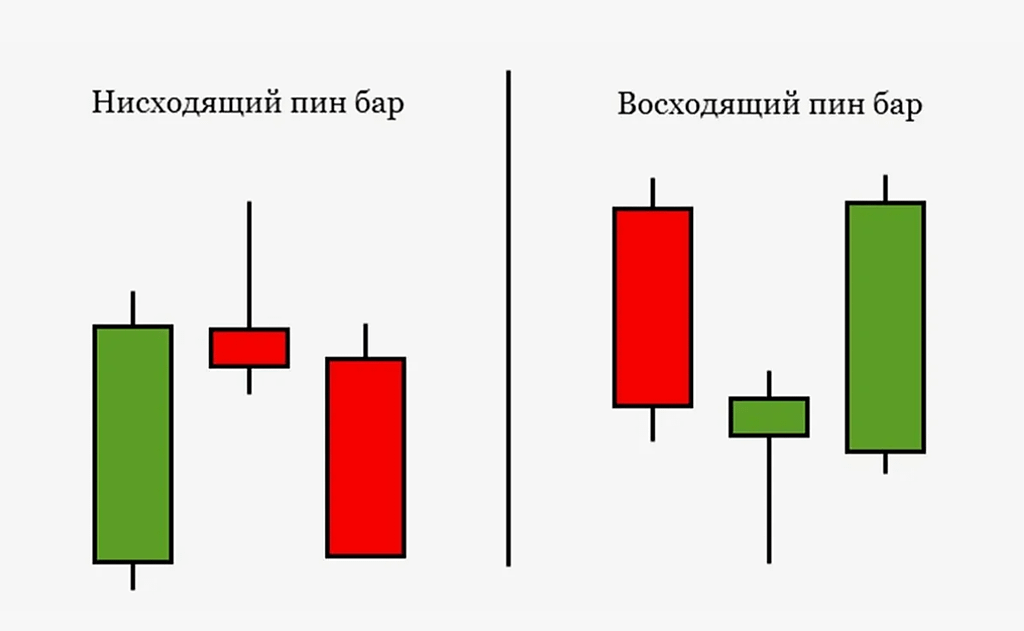
The simplest and most powerful pattern.
How it looks:
🟢 Small body
🟢 Very long shadow on one side
🟢 Almost no shadow on the other side
What it means:
The price went into the zone, met strong resistance/support and returned back. This is a reversal signal. How to trade:
🟢 Long lower shadow (bullish pin-bar) - buy signal
🟢 Long upper shadow (bearish pin-bar) - sell signal
Where to look:
At support/resistance levels.
3️⃣ PATTERN №2: ENGULFING 🔄
How it looks:
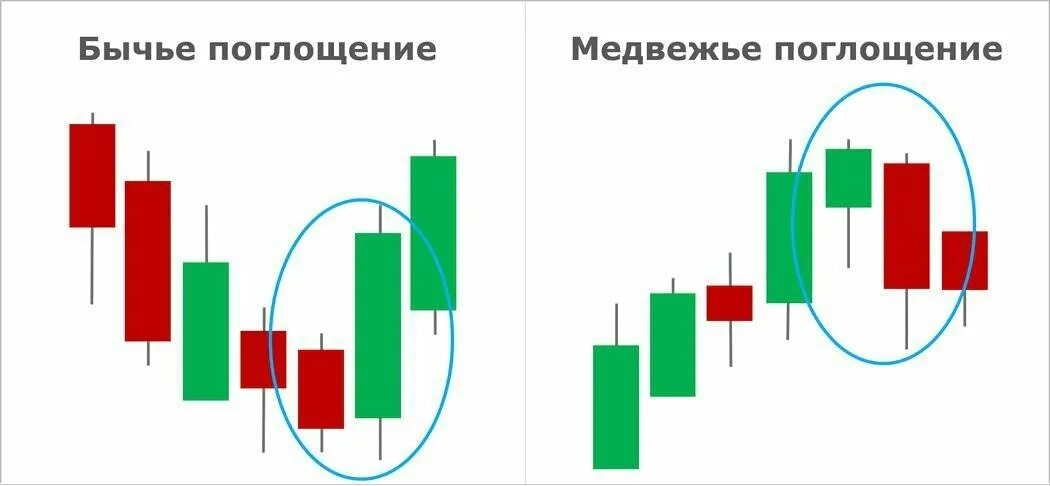
🟢 The first candle is small
🟢 The second candle completely covers the body of the first
What it means:
The market suddenly changed its mind.
Bulls (or bears) have seized the initiative.
How to trade:
🟢 Bullish engulfing (red + big green) - we buy
🟢 Bearish engulfing (green + big red) - we sell
Important:
The bigger the second candle, the stronger the signal.
4️⃣ PATTERN №3: DOJI 🤔
How it looks:
🟢 Body is very small or absent
🟢 Shadows are roughly equal on both sides
What it means:
Complete indecision. Bulls and bears in equilibrium. Often occurs before a strong movement.
How to trade:
A doji by itself is not a signal. But after a strong trend, it can mean a reversal. Wait for confirmation from the next candle.
5️⃣ PATTERN №4: HAMMER AND HANGING MAN 🔨
Basically, these are the same pin-bars, but in different positions.
Hammer:
🟢 Appears after a decline
🟢 Long lower shadow
🟢 Small body at the top
Signal: the decline has ended, it's time to buy.
Hanging Man:
🟢 Appears after growth
🟢 Long lower shadow
🟢 Small body at the top
Signal: growth may end, it's time to sell.
6️⃣ PATTERN №5: MORNING AND EVENING STAR ⭐
These are three-candle patterns. Morning star (reversal upwards):
1️⃣ Long red candle (decline)
2️⃣ Small candle (indecision)
3️⃣ Long green candle (growth)
Evening star (reversal downwards):
1️⃣ Long green candle (growth)
2️⃣ Small candle (indecision)
3️⃣ Long red candle (decline)
Very strong signals, especially at levels.
7️⃣ 5 RULES FOR USING PATTERNS
RULE №1: LOOK AT LEVELS
The pattern by itself is nothing.
Pattern at the level - signal.
RULE №2: CONSIDER THE TREND
Patterns work worse against the trend.
It's better to look for patterns in the trend (on pullbacks).
RULE №3: WAIT FOR CONFIRMATION
One candle is a hint.
The next candle is confirmation.
RULE №4: LOOK AT VOLUMES
Pattern + volume increase = strong signal.
Pattern without volume = may be false.
RULE №5: ALWAYS SET A STOP
Even the most beautiful pattern may not work.
Stop - behind the shadow of the pattern or behind the level.
8️⃣ BEGINNER MISTAKES
❌ ERROR №1: TRADING EACH PATTERN
Saw a pin-bar - bought immediately.
And it's in an empty place, without a level and trend.
✅ How to do it: Pattern + level + trend = entry.
❌ ERROR №2: NOT WAITING FOR CANDLE CLOSE
Entered inside the candle, and it closed differently.
✅ How to do it: Wait for the candle to close. Don't rush.
❌ ERROR №3: IGNORING HIGHER TIMEFRAME
On 5-minute charts, a beautiful pattern, but on the hourly - a mess.
✅ How to do it: First the higher timeframe, then the lower.
❌ ERROR №4: BELIEVING THAT THIS ALWAYS WORKS
Patterns give probability, not guarantee.
✅ How to do it: Risk management is more important than any pattern.
🧠 MAIN THOUGHT
Candles are the voice of the market.
They tell who is stronger now: bulls or bears. Learn to hear this voice, and you will stop guessing. Pin-bars at levels. Engulfing after the trend. Dojis before a breakout. It’s not magic. It’s a language accessible to everyone.
👇 QUESTION FOR YOU:
What candlestick patterns do you use?
Or are you just looking at the color?
Share your experience in the comments 🔥
If the post was useful - save it and like it 👍.
Subscribe, there's no fluff here, just practice.


#StrategyBTCPurchase #Market_Update #trading #BinanceSquare #BTC