⏰ Updated at 8:34 on 07/08/2025
Observing the recent developments of $SUI , I see that after a strong drop from the peak of 4.4478, the price has created a bottom around 3.2649 and is gradually recovering with stable buying power. Could this be the “accumulation” phase before bouncing back? Let's analyze through each frame:
🕓 4-hour frame – Recovering after the bottom, the trend is gradually shifting positively
On the 4-hour frame, after hitting the bottom of 3.2649, SUI has had quite a stable recovery to the current area of 3.51. The most recent 4-hour candle closed above both MA7 and MA25, indicating that buying power is gradually returning. RSI(6) surpasses the 60 mark – a positive signal.
MACD has crossed from the bottom, histogram is gradually narrowing and leaning towards positive – indicating that the downtrend is clearly weakening.
=> I assess that SUI is re-accumulating after a deep decline, and if it holds the range of 3.45 – 3.50, the likelihood of extending the recovery is high.
⏱️ 1-hour frame – Stable uptrend, price sticking to MA7
On the 1-hour frame, SUI has made a strong recovery from the area of 3.32 and continuously closed candles above MA7 and MA25. The price is gradually regaining short-term upward structure, with RSI(6) maintaining around the level of 60 – there is still room for increase.
MACD is moving sideways but approaching the positive zone, indicating that selling pressure has weakened and buying power is taking over.
=> If SUI breaks through the resistance zone of 3.54, it is highly likely to return to the old peak area near 3.63 – 3.65.
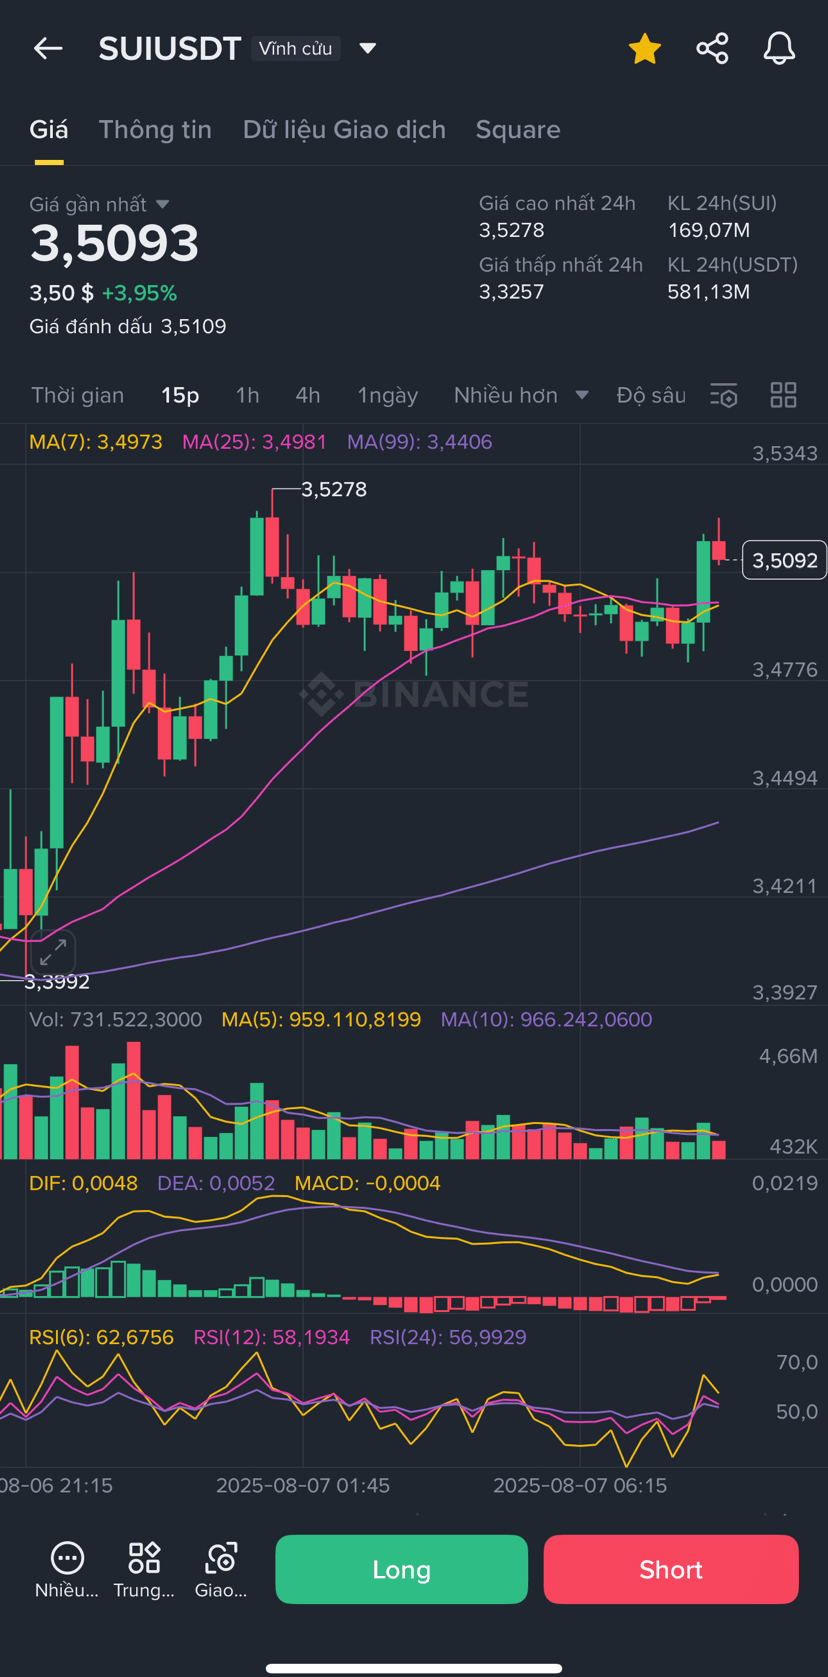
🕒 15-minute frame – Creating a short-term bottom and recovering quickly
On the 15-minute chart, after the drop to 3.32, SUI has created a nice bottom and surged strongly. The most recent candle surpassed MA25, along with RSI bouncing to 59.4 – indicating that the recovery momentum is strong.
Volume increased significantly during price rebounds – a sign that short-term money flow is returning.
=> This is the ideal short-term “accumulation” time frame. If SUI holds above 3.48 – 3.50, it can continue to push the price short to 3.56 – 3.60.
📌 Summary of personal perspective:
SUI is in the process of recovering after a quite deep decline, and all three time frames are showing positive signals again. If it maintains the support range of 3.48 – 3.50, this is a good opportunity to enter trades according to the recovery trend.
🎯 Personal trading setup:
Entry (enter trade): 3.48 – 3.51
Stop Loss: 3.43
Take Profit 1: 3.56
Take Profit 2: 3.63
Take Profit 3: 3.70 – if there is a strong breakout
📌 Order management: When TP1 is reached, move SL to entry to reduce risk
🚀 The scenario I am monitoring:
🔸 Bull case: SUI holds above 3.48 and breaks 3.54 → strong increase to 3.63 – 3.70
🔸 Bear case: If it loses 3.43 → risk of retesting the old bottom of 3.32
👇 How do you all see SUI? Should we buy more or wait for confirmation of the new trend? Let's share our perspectives!
👉 I mainly trade on Binance – anyone new can use the link below to permanently reduce trading fees (and support me a little): thank you very much everyone
Invitation code: GRO_20338_SMYIM