🔥 $PLUME
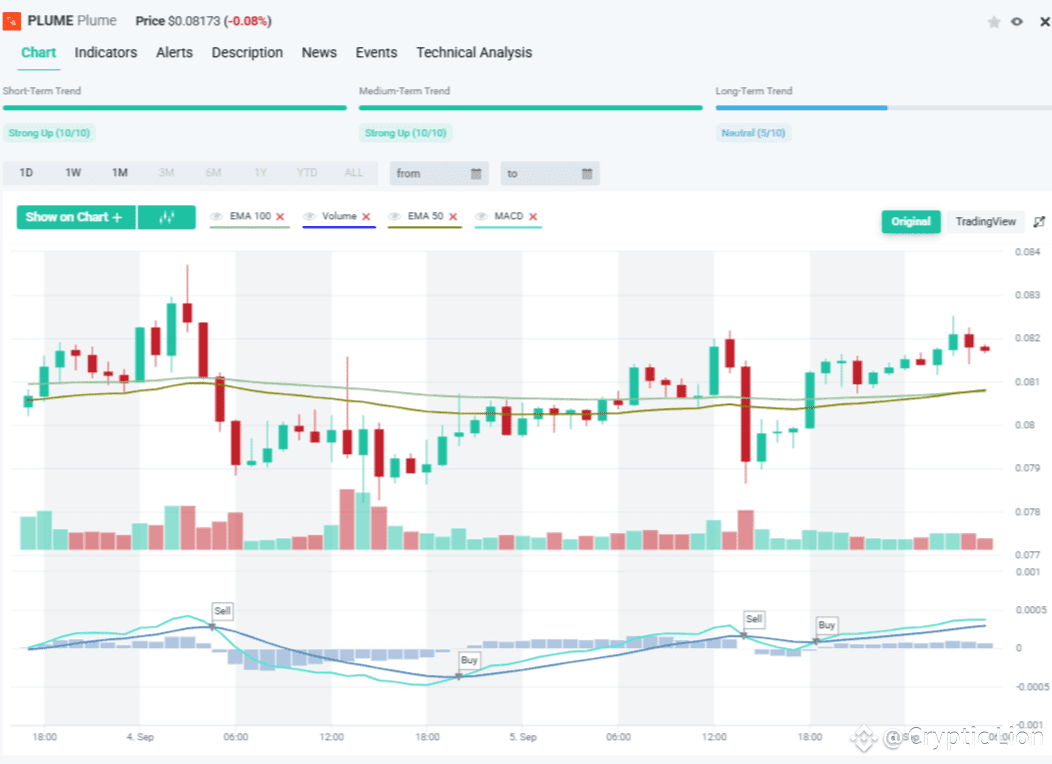
The Plume (PLUME) chart just unleashed a trader’s dream signal — the EMA 50 and EMA 100 crossover. This isn’t just another boring technical flicker; it’s the kind of moment that makes traders drop their coffee and grab their phones 📱.
📈 When the 50 EMA (short-term trend) cuts across the 100 EMA (long-term trend), it’s like a thunderclap ⚡ — a classic sign that the market is ready to explode in either direction. Bulls call this the Golden Cross, a trigger for massive upward rallies 🚀. Bears, on the other hand, watch for a Death Cross, a warning that prices could collapse under their own weight 📉.
Looking closely at Plume’s chart, the crossover didn’t go unnoticed. Right after the EMAs tangled, the market fired off Sell ➡️ Buy ➡️ Sell ➡️ Buy signals in quick succession. This back-and-forth is a textbook example of whales playing tug-of-war 🐳💥, shaking out weak hands before deciding the true direction.
📊 The MACD indicator confirms the chaos below the chart — bouncing between bearish and bullish momentum, keeping traders glued to their screens. It’s like watching a rollercoaster 🎢 inching toward the drop, and no one knows if the next move will be a heart-stopping plunge or a rocket to new highs.
🚨 The Takeaway? Plume is now in a pressure cooker. Traders are bracing for a breakout moment that could redefine its short-term trajectory. Whether it’s the Golden Cross glory or Death Cross doom, one thing’s certain: this EMA crossover is the spark before the fire. 🔥
👉 “EMA CROSSOVER CHAOS: Plume’s Chart Just Flashed the Signal That Could Trigger a Monster Move — Are You In or Out?”
As always, DYOR before any trade!
👉👉 Trade here $PLUME #RedSeptember