Japanese candlesticks 🕯️ — a very comprehensive and deep explanation
A quick introduction (Why are Japanese candlesticks important?)
Japanese candlesticks are not just aesthetic drawings — they are the language of the market. Each candle encapsulates in its body and wicks (the tails) the battles of buyers and sellers over a single time frame, providing signals about momentum, indecision, and potential turning points. Modern technical analysis methods have adopted them because they give an instant picture of the psychology of market participants and allow for the construction of testable probabilistic conclusions.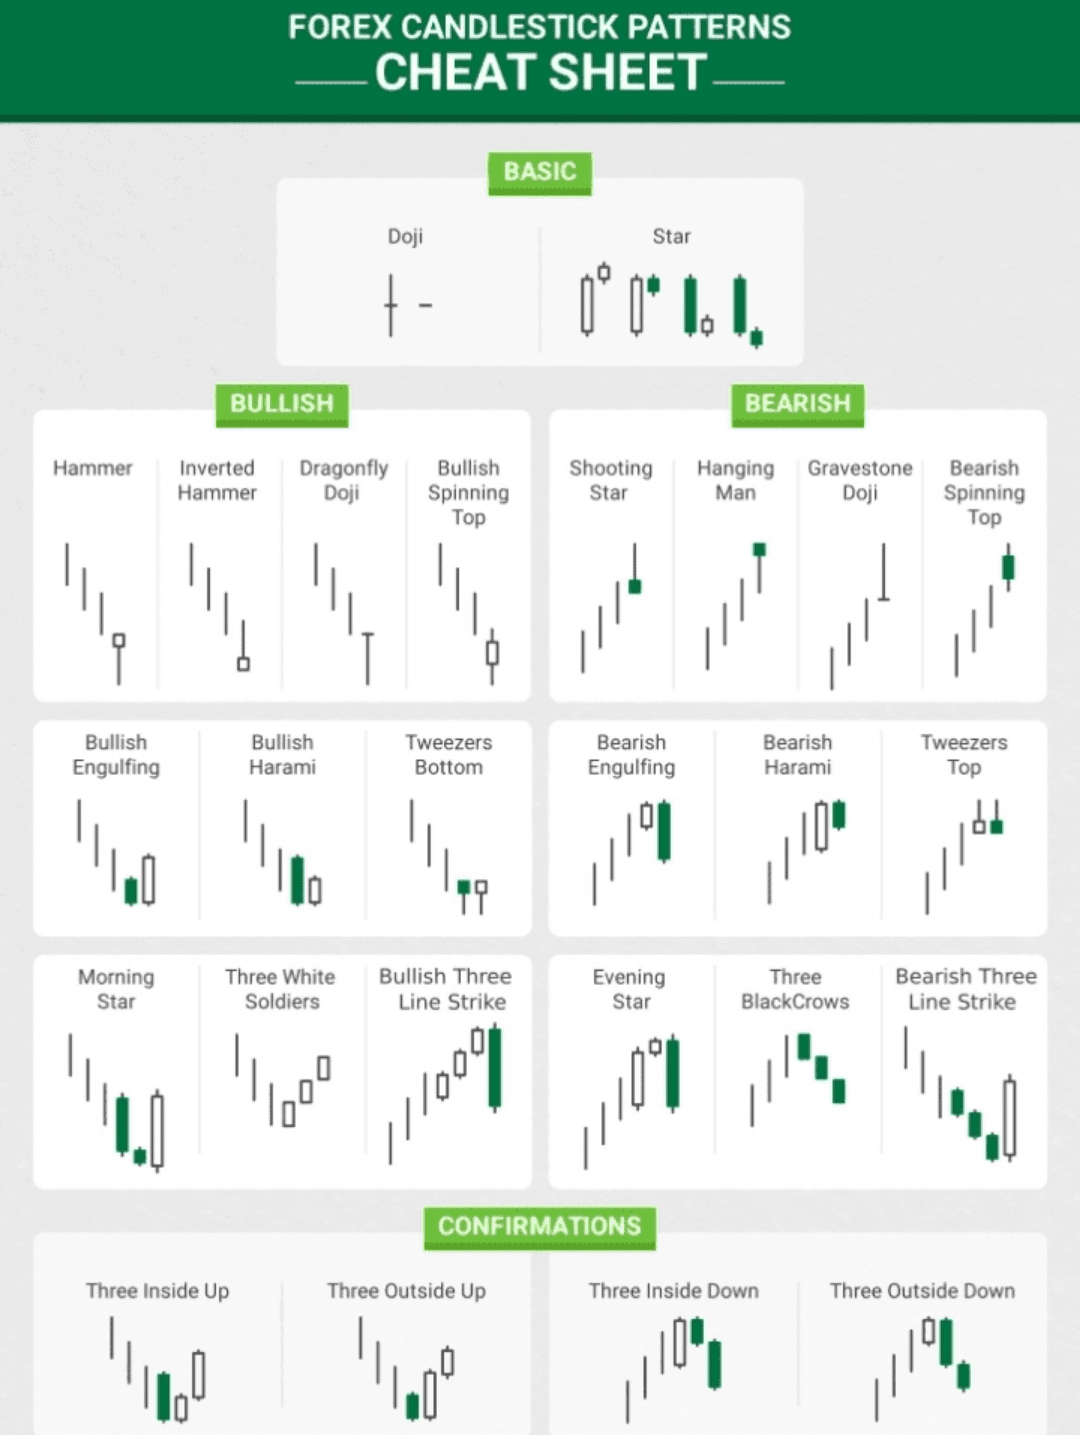 $BTC $ETH $BNB
Its origin and history
The candlestick method developed in Japan by rice trader Munehisa Homma (18th century) and was then brought to the Western world by Steve Nison, who documented and explained it in depth in his modern books and writings. The candlestick style relied on visually reading market behavior rather than just numbers. (Primary references: Steve Nison and encyclopedias of candlestick patterns and modern educational explanations).
Candlestick anatomy: Basic terminology (simple yet a solid foundation)
Real Body: The difference between the opening price and the closing price.
Upper Shadow and Lower Shadow: Represent the highest and lowest price during the period.
Color/Filling: Typically, the bullish candle is colored one color (green/white) and the bearish one in another color (red/black) — but the analysis should be based on the closing position relative to the opening, not just the color.
Body/Shadow Length: An indicator of strength or confusion — long body = strong momentum; long shadow against a short body = hesitation or testing levels.
Quick classification of patterns
Single Candle: Example: Hammer, Shooting Star, Doji, Marubozu.
Double: Engulfing, Harami, Piercing, Dark Cloud Cover.
The trio: Morning/Evening Star, Three White Soldiers / Three Black Crows, Rising/Falling Three Methods.
Continuation vs. Reversal: Some patterns give a clear reversal signal, while others indicate continuation or temporary pullback in momentum.
In-depth explanation of each candle/pattern (formation — market psychology — confirmation rules — how to trade)
> Important Note: The interpretation of any pattern depends on context (previous trend, support/resistance level, time frame, and volume). There is no confirmed candle by itself — just probabilities.
1) Single Candles
Hammer — Hammer
Formation: A small body at the top of the range with a long lower shadow usually at least twice the length of the body.
Psychology: In a decline; sellers pushed the price down but it rebounded and closed near the opening — buyers started to react.
Confirmation: A bullish candle after the hammer or closing above the peak of the hammer (preferably with increased volume on the next candle).
Typical trading rules: Enter at the close of the confirmation candle or when breaking the hammer's peak; stop below the hammer's lowest point; first target at the nearby resistance.
Hanging Man — Hanging Man
Formation: Similar to the hammer but appears in an uptrend.
Psychology: It appears that buyers could not fully push the price higher — a warning signal for a potential bullish reversal.
Confirmation: Lower close or subsequent bearish candle.
Inverted Hammer — Inverted Hammer
Formation: Long upper shadow and small body at the bottom.
Psychology: Buyers attempted to push the price higher but could not sustain the gains — after a decline, it can indicate the beginning of a transparent reversal.
Confirmation: The next candle is bullish and closes above the peak of the inverted candle.
Shooting Star — Shooting Star
Formation: A small body with a long upper shadow appearing at the end of an uptrend.
Psychology: Significant initial buying pressure could not sustain the gains; sellers regained control.
Confirmation and rules: Like the hanging man but the opposite: wait for a bearish close below the body of the shooting star.
Marubozu — Marubozu
Formation: A candle with almost no shadows; either fully bullish or fully bearish.
Psychology: Clear control by sellers or buyers throughout the period — gives strong momentum and can indicate continuation of the existing trend.
Trading: Entering with trend continuation with a stop at a percentage of the body.
Doji — Doji (in its types: Long‑Legged, Dragonfly, Gravestone)
Formation: Opening and closing are approximately equal (very small or no body).
Psychology: A balance of powers or confusion in the market; if it comes at support/resistance or after strong momentum, it is impactful.
Types and brief explanations:
Dragonfly Doji: Long lower shadow, bullish signal if it comes after a decline.
Gravestone Doji: Long upper shadow, bearish signal if it comes after an uptrend.
Long-Legged Doji: Long shadows on both sides = clear hesitation.
Confirmation: Do not enter on a doji alone — wait for a follow-up candle or a breakout of an important level.
(Reference sources for applying these rules in practice are available in analyst guides and reports as well as Steve Nison's books).
2) Double Patterns
Engulfing (Bullish/Bearish) candle
Formation: The body of the second candle fully covers the body of the first (often in the opposite color).
Psychology: A clear change in control — for example: after a decline, a bullish candle closes higher and engulfs the previous one => a shift in influence from sellers to buyers.
Trading Rules: The strength of the signal increases if the engulfing occurs near support/resistance and with higher volume.
Piercing Line / Dark Cloud Cover
Formation: A double reversal pattern appearing near bottoms/tops: Piercing = bullish reversal when the bullish candle closes above the midpoint of the previous bearish body. Dark Cloud = the opposite.
Trading: Confirmation is required by closing above or below the midpoint of the body.
Harami / Harami Cross
Formation: A small body located within the body of the previous candle — indicates a decrease in momentum.
Meaning: Significant as an early signal of confusion; when does it become strong? When followed by a close that shows an opposite direction.
Tweezers (Tweezer Tops/Bottoms)
Formation: Two equal or closely spaced wicks at a peak or trough over two consecutive periods.
Psychology: Testing a strong level — failure to break a level after two attempts may give a reversal.
3) Triple Patterns (very strong when criteria are met)
Morning Star / Evening Star
Formation: Strong bearish/bullish candle -> small candle (doji or spinning top) -> strong opposite candle.
Psychology: Shows loss of original momentum and the beginning of opposing influence.
Practical guidance: Wait for the close of the third candle and then enter, placing a stop below/above the middle star.
Three White Soldiers / Three Black Crows
Formation: Three consecutive strong candles in one direction with each candle opening inside the body of the previous one.
Psychology: Strong confirmation for continuing the new trend.
Rising / Falling Three Methods
Formation: A strong candle followed by three small candles against the trend and then another strong candle in the same direction as the first.
Meaning: Continuation of trend — brief corrective periods followed by a resumption.
Abandoned Baby (Child Abandoned)
Formation: Gap then a lonely doji with gaps on both sides — a strong reversal signal but rare.
How top analysts build their analysis using candles (a practical step-by-step approach)
1. Start with the larger timeframe: Is the primary timeframe (daily/weekly) in a clear direction? Candles give better signals in clear contexts.
2. Identify pivot levels: Support, resistance, supply/demand areas, significant price sessions.
3. Look for candles/patterns at these levels: A pattern at a pivot area is stronger than the same pattern in a normal market.
4. Check the volume: Increased volume with a reversal pattern strengthens the signal; low volume weakens it.
5. Multi-timeframe verification: A reversal candle in H1 may not mean anything if the daily frame does not show a reversal.
6. Confirmation with additional indicators (optional): RSI/momentum indicators to align the reversal — do not rely on them alone.
7. Entry, stop, and target rules: Always calculated entry (close/breakout/retrace) and clear stop to limit risks.
Golden rules (mental rules agreed upon by top analysts)
Do not trade a lone pattern out of context;
Do not enter before a reasonable confirmation — especially with patterns with high failure probability;
Trading volume and the point where the candle appears are more important than its name;
Combining with supply/demand levels increases the success rate;
Frequency and statistics: Collecting data on your favorite patterns to know their characteristics in your traded market (different symbols give different behaviors).
Common mistakes made by traders
Blind faith in a single pattern without considering the broader context.
Interpreting doji or single candle as a signal of execution without waiting for confirmation.
Ignore gaps and market news (candles can be misleading in low liquidity periods).
Failure to set an appropriate stop loss.
Practical example: A quick checklist before opening a trade on a reversal candle.
1. Is the pattern on a suitable time frame for your strategy?
2. Is the pattern at a significant support/resistance level?
3. Is there a clear change in volume?
4. Is there confirmation (closing of the next candle, breaking the level)?
5. Where will you place the stop loss? (Below/above the critical point of the chart)
6. What is the first/second target? What is the risk/reward ratio?
Reference for the most important names of patterns (name in Arabic — name in English)
> This is a focused list of the most famous patterns used by analysts daily.
English English
Hammer Hammer
Hanging Man Hanging Man
Inverted Hammer Inverted Hammer
Shooting Star Shooting Star
Marubozu Marubozu
Doji (Regular/Dragonfly/Gravestone) Doji (Long‑legged, Dragonfly, Gravestone)
Spinning Top Spinning Top
Bullish Engulfing Bullish Engulfing
Bearish Engulfing Bearish Engulfing
Harami Harami
Harami Cross Harami Cross
Piercing Line Piercing Line
Dark Cloud Cover Dark Cloud Cover
Tweezer Tops/Bottoms Tweezers (Top/Bottom)
Morning Star Morning Star
Evening Star Evening Star
Three White Soldiers Three White Soldiers
Three Black Crows Three Black Crows
Rising/Falling Three Methods Rising/Falling Three Methods
Abandoned Baby Abandoned Baby
Three Inside Up/Down Three Inside Up/Down
Three Outside Up/Down Three Outside Up/Down
Quick Conclusion
Japanese candles are a powerful tool if you know how to use them in the right context. Top analysts do not look for a 'miracle' single pattern, but for the recurrence of multiple signals — the candle, the level, the volume, and momentum across different time frames. Memorize the rules, compile your statistics
Dr. Ghassan
Below I have listed the primary sources on which the explanation is based — and these are five pivotal references that I relied on during the compilation:
Steve Nison — Founding reference for Japanese candlestick methods.
Explanation and detailed anatomy of candlestick types (Investopedia).
Summaries and a list of trade patterns and a cheat sheet (BabyPips).
Statistics and reliability of patterns and the candlestick patterns encyclopedia (Thomas Bulkowski / Wiley).
Arab sources centered around explaining terms and names in Arabic to match the following environment (e.g., NAGA Academy and other Arabic websites).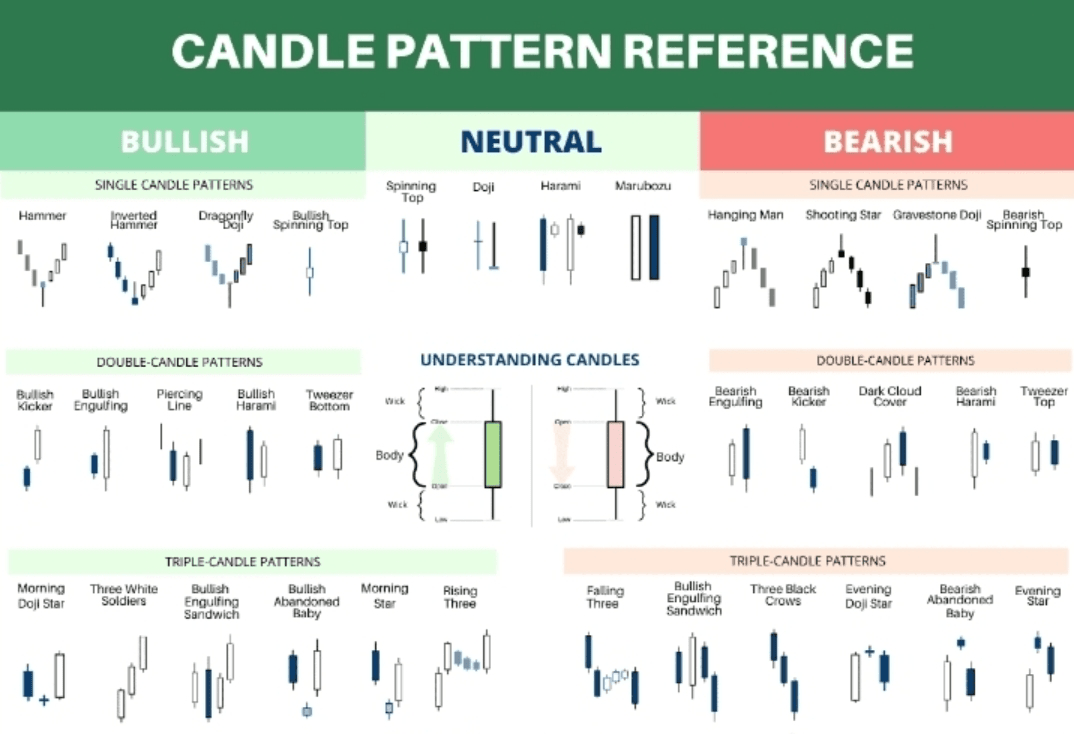
#BTCBreaksATH #BNBBreaksATH #Hamdyelbealy #GoldHitsRecordHigh