1. A little bit of mathematics
One of the most famous numerical sequences in history is the Fibonacci sequence, which is given by:
1, 1, 2, 3, 5, 8, 13, 21, 34, 55, 89, ... and so on.
Starting from the third number, the next number is the sum of the two preceding ones. For example, 2 = 1 + 1, 5 = 3 + 2, 89 = 55 + 34.
The most interesting thing is that the ratio between two consecutive numbers always approaches a fixed number: 21 ÷ 13 = 1.615, 89 ÷ 55 = 1.618. In other words, as the sequence progresses, the ratio between two numbers gets closer and closer to the number 1.618, known as the golden number. Thus, the growth of the sequence seems to follow a very well-defined pattern, defined by the golden ratio 1.618.
If we divide in the opposite direction, that is, taking the previous number as the numerator, the result of the division always approaches the number 0.618. For example, 55 ÷ 89 = 0.618. Thus, the sequence decreases following the golden ratio 0.618, which is the inverse of the number 1.618.
2. How does the Fibonacci sequence govern natural and human patterns?
This ordered pattern of growth or retracement is often observed in natural, artistic, and human patterns, associated with patterns of balance and harmony. For example, the arrangement of petals in flowers, the spirals of seashells and DNA molecules, and the arrangement of seeds in the center of a flower.
In architecture, famous buildings like the Parthenon in Athens follow the proportion 1 : 1.618. In the human body, the ratio between a person's height and the distance from the navel to the ground tends to always be 1.618.
3. What is the relationship between the Fibonacci sequence and the financial market?
Although the financial market often appears chaotic, especially during times of high volatility, it is essentially governed by collective human behaviors. For example, during a rise, many people act driven by FOMO (fear of missing out) and follow the herd. In a decline, people act out of panic and extreme fear of losing their assets.
So there will always be an order within the chaos, and the Fibonacci sequence can be useful for predicting the consequences of collective human behavior in extreme situations. It has been found, for example, that after a strong rise, the inevitable price corrections for profit-taking occur in a relatively predictable manner:
A) A weak correction usually reduces the price by 0.236 or 23.6%. This number can be obtained by dividing any number in the Fibonacci sequence by another that is 3 positions ahead;
B) A moderate correction usually reduces the price by 0.382 or 38.2%. This number corresponds to dividing a number in the Fibonacci sequence by another two positions ahead;
C) A strong correction usually reduces the price by 0.618 or 61.8%, which is the golden ratio of Fibonacci;
D) A very strong correction usually reduces the price by 0.786 or 78.6%, which corresponds to the square root of 0.618.
4. How to use the Fibonacci retracement tool in the Binance app?
In Trading View mode, you can activate the Fib Retracements tool. You should position the tool cursor (small blue ball) at the lowest point of the chart, click at that point, and drag the large blue ball that forms after the click to the highest point of the chart.
The tool will position the retracement percentages in the opposite direction, that is, from top to bottom, with 0% at the highest point and 100% at the lowest point.
For example, the figure below shows the retracements observed for ETH, starting from the last high.
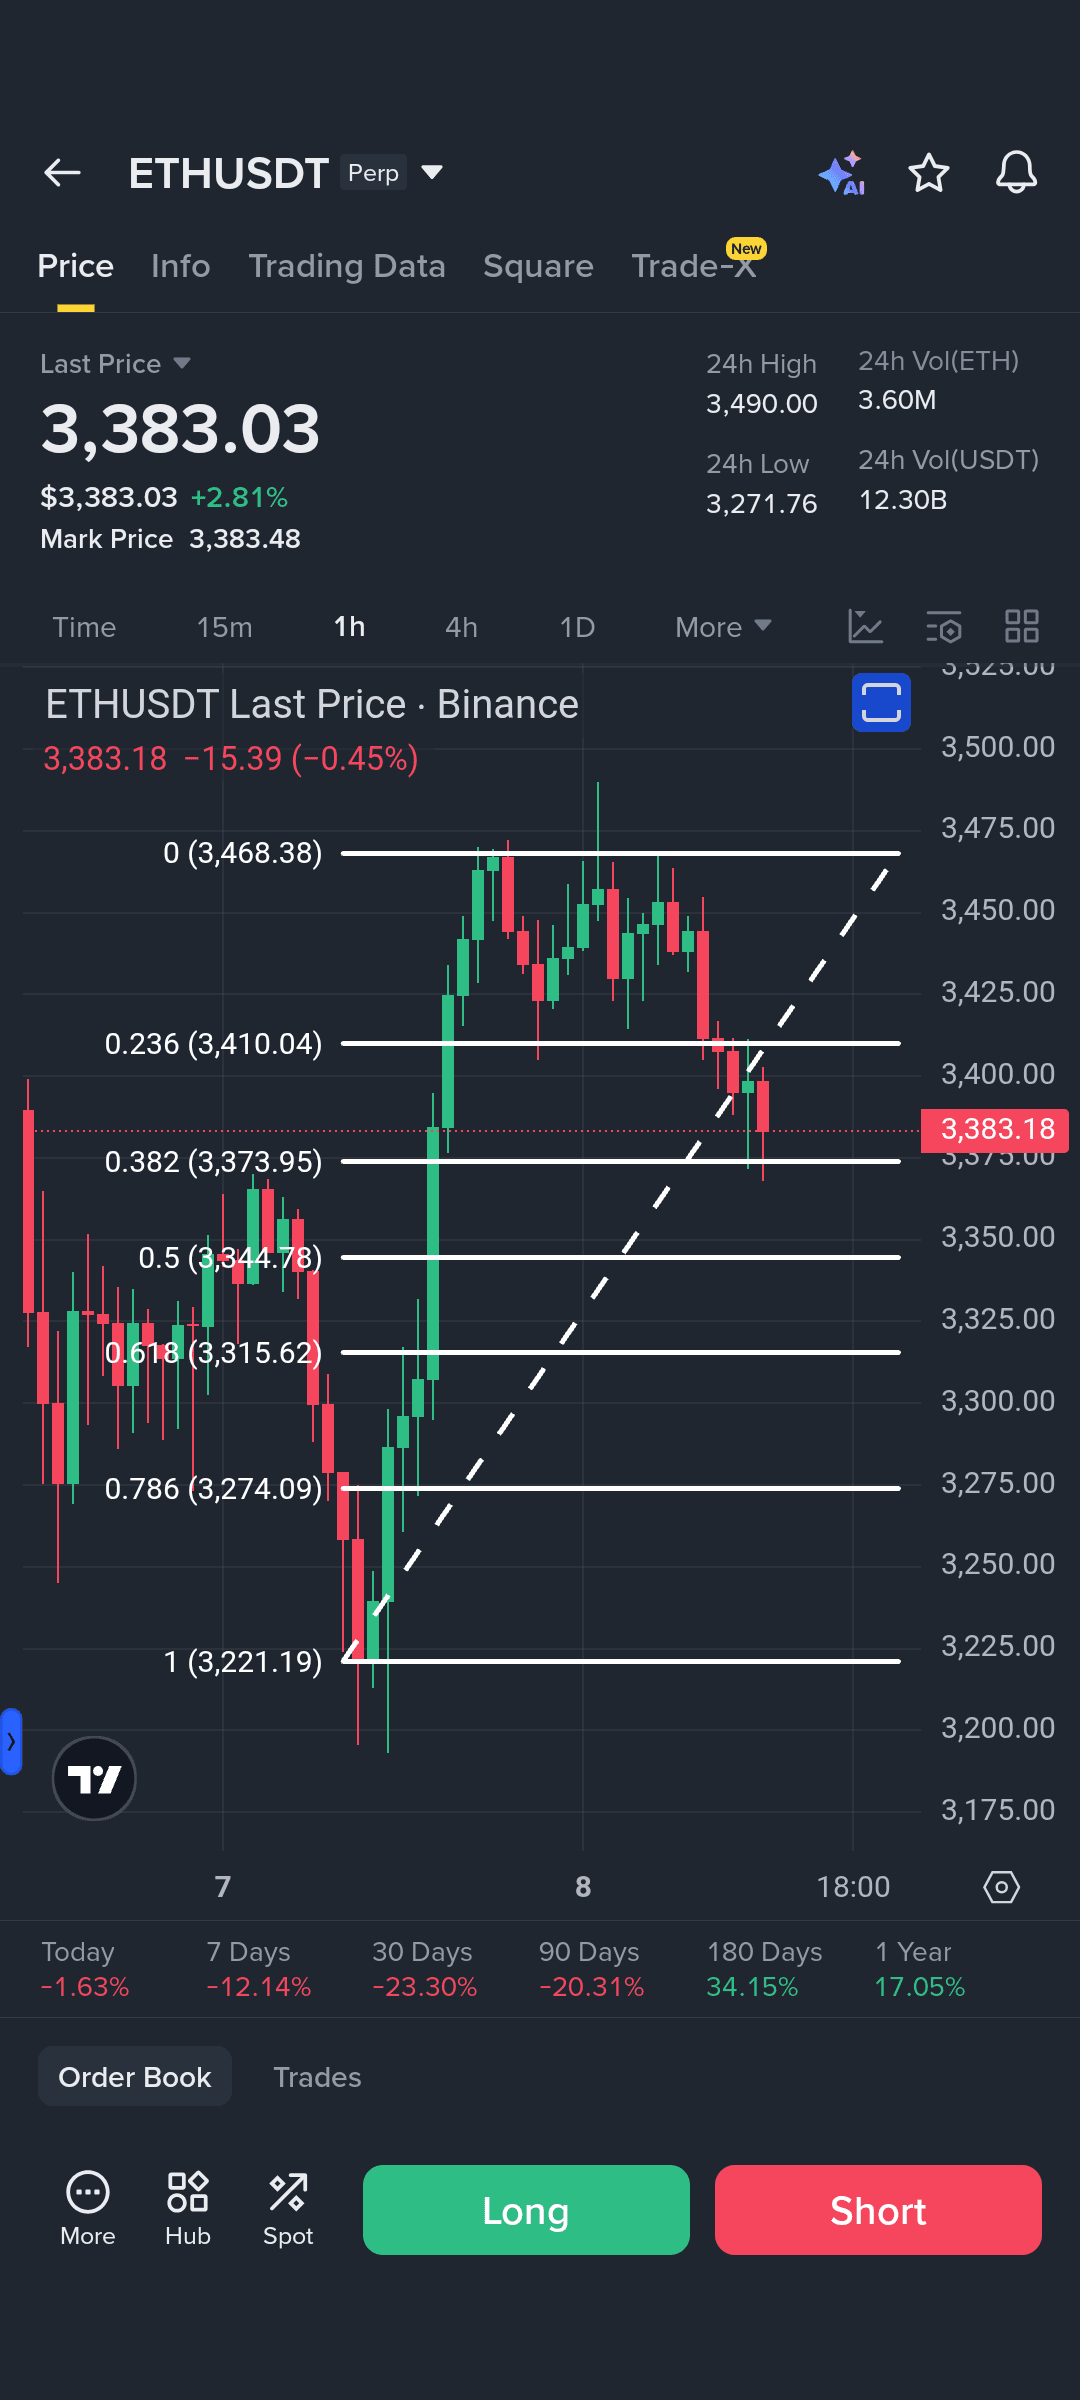
It is noted that the price of ETH found strong support in the range of $3373, which corresponds exactly to a retracement of 38.2%.
To know at which Fibonacci retracement level to enter a trade to buy at a low will depend on the ability of each level to sustain the price and the ability of the price to bounce back up after touching a certain retracement level. For this, it is necessary to monitor other indicators, such as RSI, MACD, OBV, CMF, and moving average crossovers. It is also recommended to use the Ichimoku system to assess the overall market trend for the analysis period.
Greetings from Cryptocoin Place.