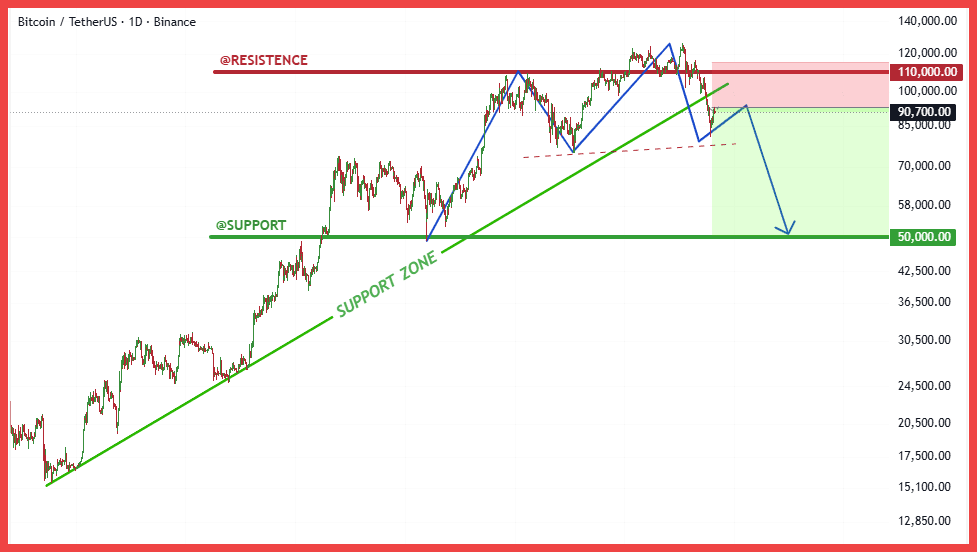
A serious warning to those who intend to Long/buy BTC at this time. Looking at the D1 chart, we see an extremely negative signal: the uptrend support line (Support Zone) has been decisively broken.
This is a clear reversal signal after BTC's failure to break through the significant resistance level of $110,000. Currently, the price is trying to retest the old support area that has been broken (around $90,700). This is a typical dead cat bounce before continuing the downtrend. If this area holds as a new resistance level, the selling pressure will return very strongly.
The price model is showing signs of a top distribution, with each successive peak lower than the previous one, confirming a depletion of buying power. In this scenario, buying in at this moment is extremely risky, akin to catching a falling knife. The next target for a decrease indicated on the chart is the important psychological support zone of $50,000. It is recommended for everyone to stay out and observe or consider reducing their position. Do not let greed blind you when the market is screaming signals of a downtrend.
Are you stuck in any bad charts similar to this one? Comment so we can all avoid it together.
#BTC #Bitcoin #CanhBaoCrypto #dump #BinanceSquare #Crypto