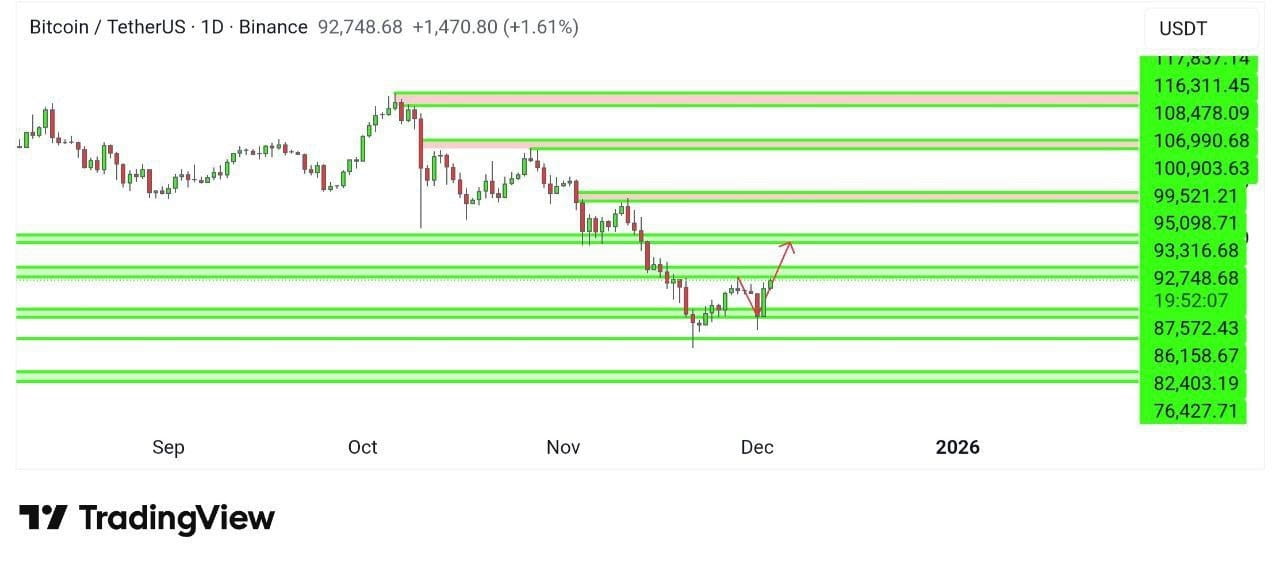
This is the Bitcoin chart where multiple support and resistance zones are marked in green.
It can be seen—
BTC has been in a downtrend from September to November.
A strong bounce occurred at the end of November, where a long wick below (indicating buyers' strength) can be seen.
The chart likely indicates a potential higher low with the red arrow.
The red arrow ahead indicates that the price may now move towards the upper resistance zone.
🔍 Technical Analysis
1️⃣ Trend
BTC is now gradually entering a potential trend reversal zone from the downtrend.
The first higher low has been formed—which could be the first signal of a reversal.
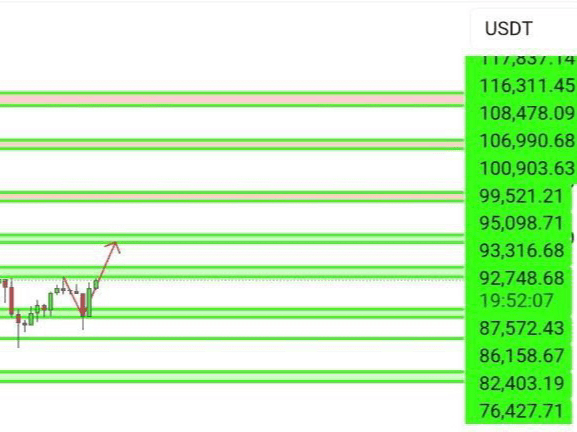
2️⃣ Support level (Major supports)
The levels that appear as strong support on the chart—
87,572 USDT
86,158 USDT
82,403 USDT
76,427 USDT
Buyers have been active at these levels before and there is likely to be a strong reaction again.
3️⃣ Resistance level (Major resistances)
The zones from which the price has been repeatedly rejected above—
93,316 USDT
95,098 USDT
99,521 USDT
100,903 USDT
The current price is 92,748 USDT — which is very close to the lower resistance.
4️⃣ Possible movement on the chart (as marked)
The red arrow given on the chart—
$BTC bounced from the lower support.
The possibility of testing the next resistance has now been indicated.
That is, the 93,300–95,000 range is an immediate resistance zone.
📌 Summary in plain language
BTC is now trying to recover from the bottom.
If this powerful bounce can be maintained, it is normal for the price to go to the upper resistance (93k → 95k) zone.
But if those levels cannot be broken, there may be another small pullback.#BTC☀