Everyone looks at the RSI at the extremes…
Few realize that the RSI line is an almost perfect guide to price strength.
When you learn to read the direction of the RSI as if it were a 'trend', something magical happens:
📈 The RSI shows you where the price wants to go before the price goes.
🔍 1. THE RSI LINE AS A DIRECTION GUIDE
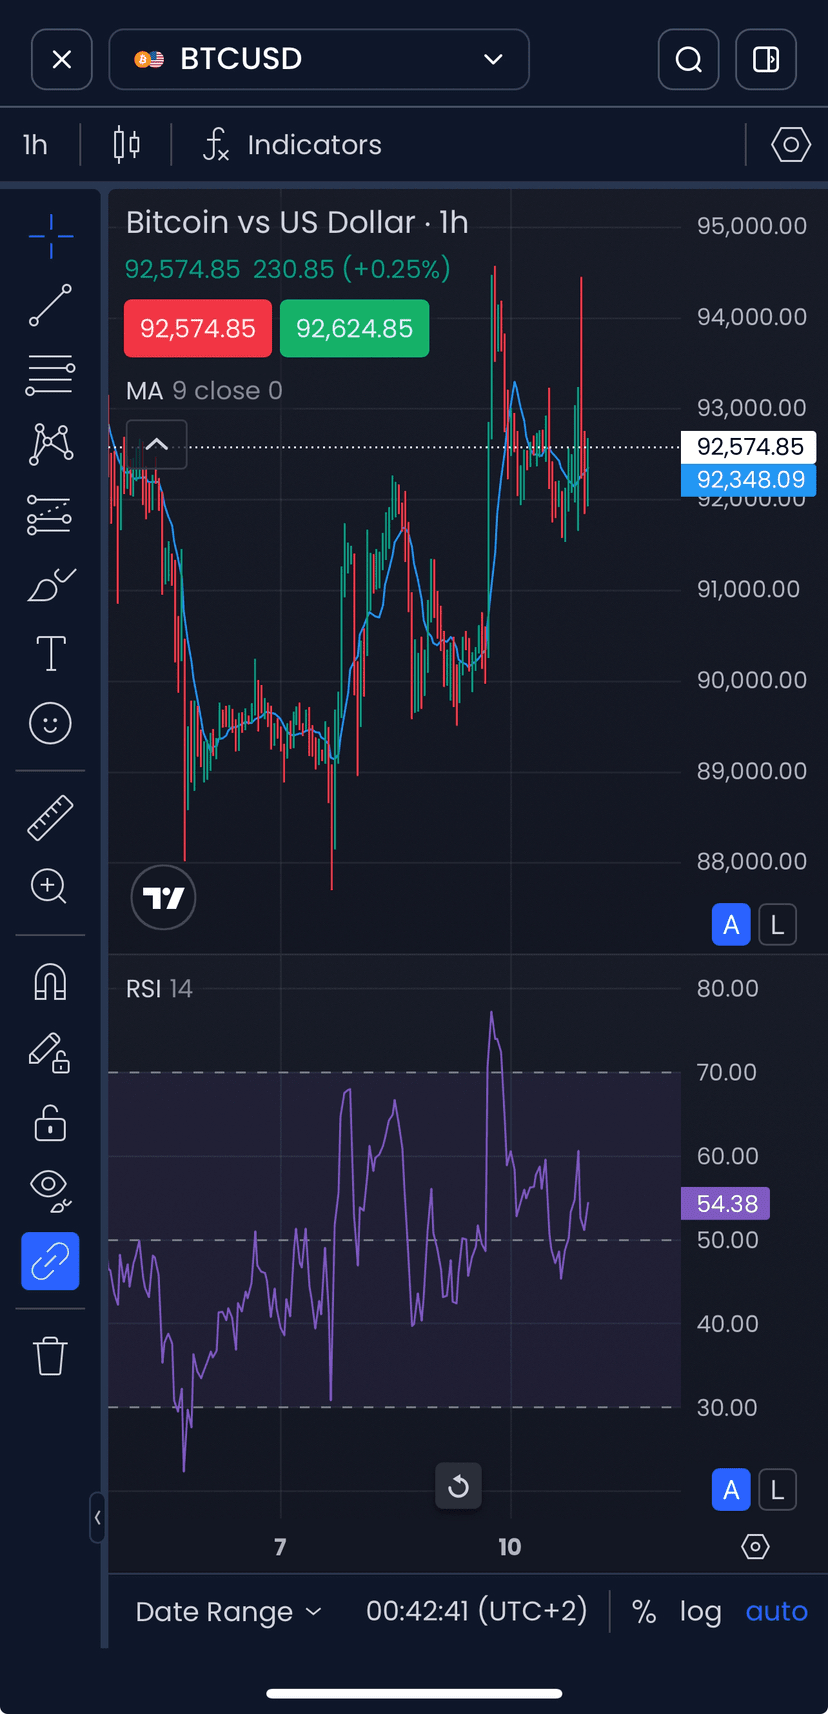
Observe on the chart:
When the RSI starts to form higher highs and higher lows → buying strength increasing.
When it forms lower highs and lower lows → selling strength dominates.
It's as if it were a 'mini trend' within the strength.
👉 Many times the price hasn't shown the turn yet... but the RSI has already shown it.
And this gives an absurd advantage in entry timing.
📉 2. EXTREMES = AREAS OF INSTITUTIONAL INTEREST
When the RSI touches its extremes:
Above 70 → area where institutions start to distribute liquidity.
Below 30 → area where institutions start to accumulate liquidity.
These regions act like sensors:
Whenever the RSI is 'stretched', very close to the extremes, you will see:
✔ strong rejections,
✔ long wicks,
✔ deep reversals,
✔ or at least a breath before the next movement.
Because no one buys at the top and no one sells at the bottom for a long time — especially the big players.
🔥 3. THE SECRET: THE 'RETURN' READING OF THE RSI
The real movement is not just at the touch of the extreme...
It's in the strength of the return.
RSI hits 30 and bounces back aggressively → strong reversal signal.
RSI hits 70 and turns strongly → buyer exhaustion signal.
The price reacts right after.
🎯 4. CONCLUSION: THE RSI IS AN INSTITUTIONAL MAP
When you connect:
✔ the RSI line
✔ the direction of strength
✔ institutional extremes
✔ the return of the turn
… you can practically see the next market intention.
That's why the RSI is much more than 'overbought and oversold'.
It's a strength reading.
It's a reading of intention.
It's an institutional reading.