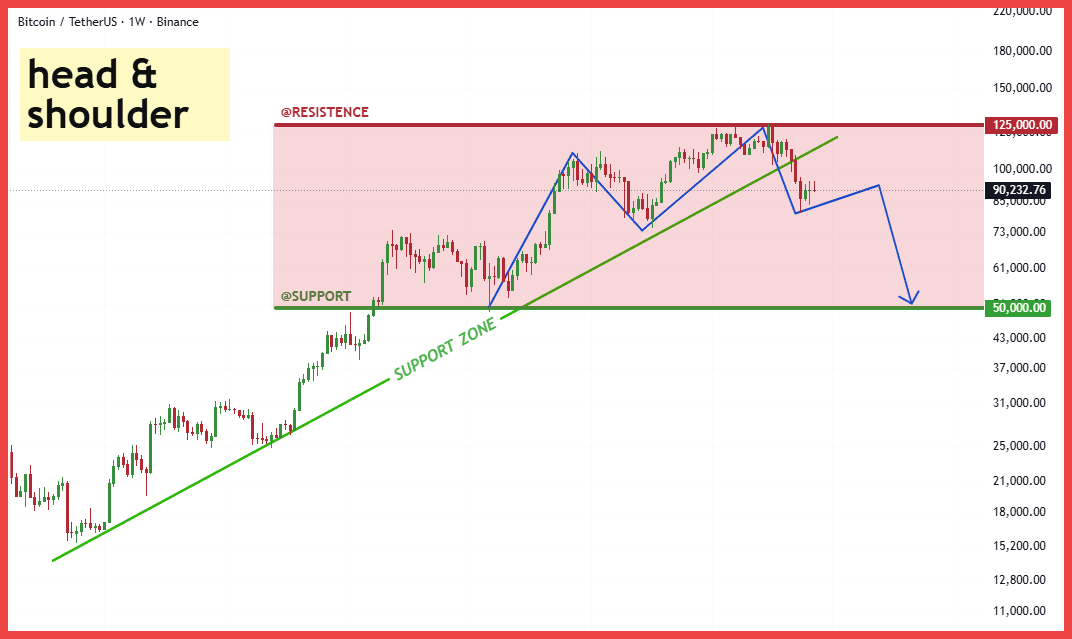
Ok guys, let's dissect this super tasty $BTC chart and see if there's anything interesting. The W1 chart is sending a very clear bearish signal that we need to pay attention to immediately.
Technical analysis shows that after peaking at the resistance level of $125,000, $BTC has formed a classic Head and Shoulders (H&S) pattern. More importantly, the price has broken down the green Neckline, which is the support line for the long-term uptrend. Currently, we are seeing the price trying to bounce back to retest this line, around the $90,000 mark. If $BTC cannot regain this support line, the next bearish target will be the strong Support area at $50,000. This is an important psychological and technical buffer zone.
Fundamentally, $BTC remains solid due to huge capital flows from Spot ETF funds and increasing institutional approval globally. The recent Halving event also reinforces the scarcity of this asset in the long run, laying a solid foundation for the next growth cycle.
Action plan: In the short term, we need to be cautious about the possibility of a drop to $50,000. This is a great opportunity to DCA for the long term if this scenario occurs.
Recommendation for everyone to HOLD and Stacking $BTC at Binance
Brothers are holding which altcoin, just comment, I will check the chart for you!
#BTC #Bitcoin #PhanTichKyThuat #Crypto #BinanceSquare #HODL