
Solana is making headlines again at the end of this year, and not precisely because of some sensationalist headline. The interesting thing is that several indicators that normally anticipate trend changes are starting to align: there is money entering consistently into products linked to $SOL , the signals in the derivatives market look better, and there is also an important technical resistance that seems to be giving way. If you follow the crypto world, this is the type of moment that deserves attention before things really start to move.
Right now, SOL is trading around 125 dollars. The key question is not so much whether it will go up or down tomorrow, but what would need to happen for Solana to start a new bullish cycle heading into 2026.
Institutional money: six consecutive weeks of inflows (though more subdued)
One of the strongest data points in favor of Solana is the behavior of 'patient' money, the kind that does not enter suddenly seeking quick profits but moves with continuity.
ETFs focused on Solana have recorded six consecutive weeks of net inflows. However, the pace has slowed a bit: last week saw about 20.3 million dollars, quite less than the 108.34 million from the previous week. But there is one detail: in a single day (Friday), 15.68 million entered, indicating that interest is still there, just more moderate.
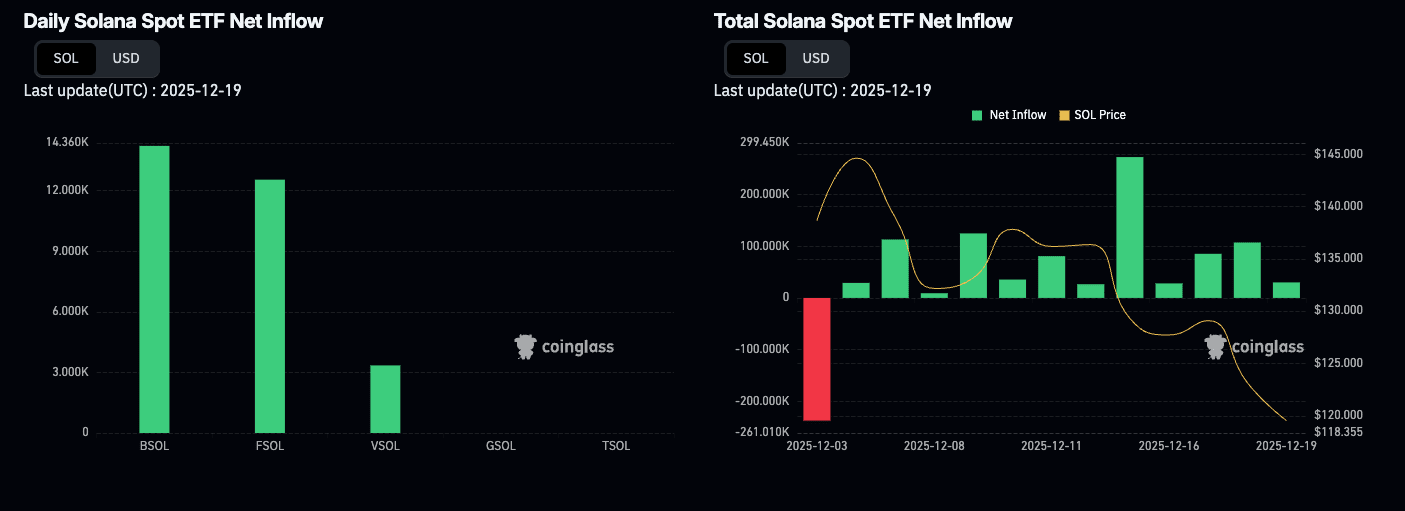
For any investor, the reading is clear: when money continues to flow for weeks, the asset tends to have a stronger bottom. And in a market as volatile as this, that is already quite significant.
The futures market: downward pressure is easing
The second piece of the puzzle is in the derivatives, and here the numbers speak for themselves.
FXStreet highlights two important data points:
The Open Interest (total capital in open futures) of Solana exceeds 7 billion dollars and remains stable. There is no massive outflow of money.
The weighted funding rate has surged: it went from -0.170% to -0.0018% in just one day. What does it mean? That it almost no longer compensates for holding short positions (bearish bets).
This matters because when funding is very negative, the market is usually filled with people betting downwards. If that funding approaches zero or turns positive, it usually means that long positions (bullish) are starting to dominate again, or at least that the bears are not pressing as much.
And when this coincides with a technical resistance about to break, things tend to get interesting.
Technical analysis: $140 marks the way
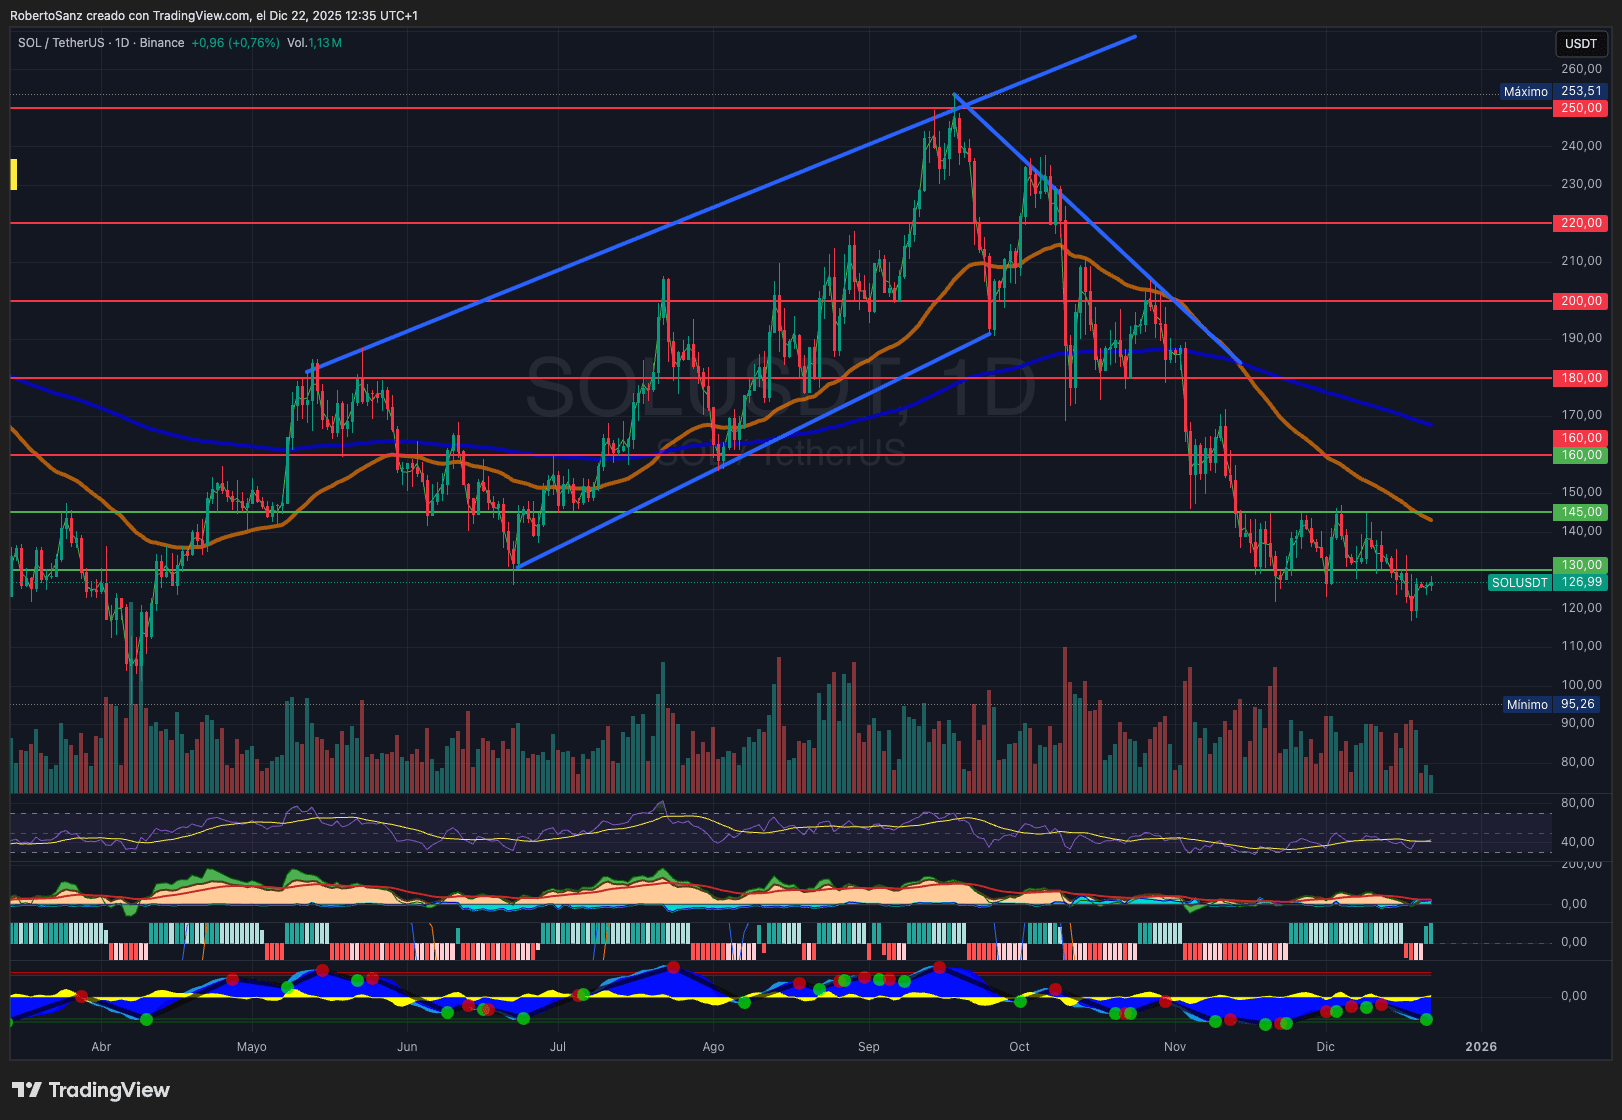
In the daily chart, there is an area that functions as a 'door': resistance around $140, linked to a bearish line that comes from the highs of October.
Levels to keep on the radar:
Important support: 121–127 dollars. As long as SOL holds here, the structure remains.
Key resistance: ~140 dollars (that bearish line we talked about).
If it breaks $140, the next targets would be:
The 50-day moving average (EMA 50) around $153
The 200-day moving average (EMA 200) near $173
Bearish scenario: If it loses $121, we could see a drop to $95.
And what do the indicators say?
The RSI is close to 45, recovering from the bearish zone towards neutral.
The MACD is improving, a sign that momentum is starting to turn.
If I have to summarize it: as long as SOL stays above $121–127, the market is 'loading' to try to break $140.
Realistic scenarios for December and the start of 2026
Here is where many people get lost going to 'magic numbers'. It is better to think in possible scenarios.
Scenario A: Clean breakout and bullish continuation
If it happens: clear daily close above $140 with good volume and funding turning positive.
Probable targets: First $153 (EMA 50), and if the market cooperates, $173 (EMA 200).
What it would mean: We would be facing a clear bullish phase, or at least a good upward stretch within a larger trend. Be careful, this does not mean there won't be corrections along the way.
Scenario B: False breakout (the typical market 'trap')
If it happens: It touches $140 intraday but does not consolidate and returns to the previous range.
Consequence: Return to the $127–$121 zone to 'reset' the excess leverage.
What it would mean: It would not be the end of the world, just the market cleaning speculative positions.
Scenario C: Loss of support and a return to defensive mode
If it happens: Clear close below $121.
Risk: Bearish acceleration towards lower levels, with $95 as a reference.
What it would mean: Here we would already be talking about a serious correction or even a bearish phase, although the institutional context could soften the fall.
Why there is more talk about SOL in Spain
When I say there is more interest in Spain, I am not basing it on a single headline, but on something that is noticeable: more conversation, more people asking about regulated products, and more investors trying to understand the cycle.
This connects with two clear trends:
Institutionalization: Flows into crypto investment products have been significant in 2025, and Solana has captured a good part of that interest.
The easiest access: If you want to expose yourself without complicating things, ETFs and ETPs are the most direct option. Constant flows (even if they vary) show that there is real demand, not just speculative noise.
In this context, tracking cryptocurrency prices (and the price in euros if you operate from here) stops being simple curiosity and becomes risk management.
What to watch if you want to refine your reading of SOL
If your goal is to anticipate (not guess), pay attention to:
Daily closes regarding $140: It is not enough to just 'touch it' intraday.
Funding rate: A shift to positive usually reinforces the bullish narrative.
Open Interest: If it rises while the price breaks resistances, it usually supports continuity. If it rises but the price does not advance, watch out for excess leverage.
Weekly flows in investment products: Continuity matters more than a single day with high volume.
The ceiling of SOL may be higher, but the market will demand confirmation from you.
My final reading is quite straightforward:
The data from ETFs and derivatives have improved (six weeks of inflows and funding recovering), and that usually anticipates important movements.
The $140 area is the hinge: if it breaks and consolidates, the market may resume a bullish narrative heading into 2026 with technical targets at $153 and $173.
If it loses $121, the script changes and we could see deeper corrections.
How far can Solana go? It depends less on 'having faith' and more on whether the price confirms the breakout with volume and derivatives backing it. In such a rapidly changing market, having clear supports and resistances is what protects you, whether you are starting with little money or have been in this for a while.
