Alright team, let's break down this juicy $BTC chart and see what's cooking. The long-term trend looks parabolic, but the immediate monthly structure is signaling caution.
Technical Analysis
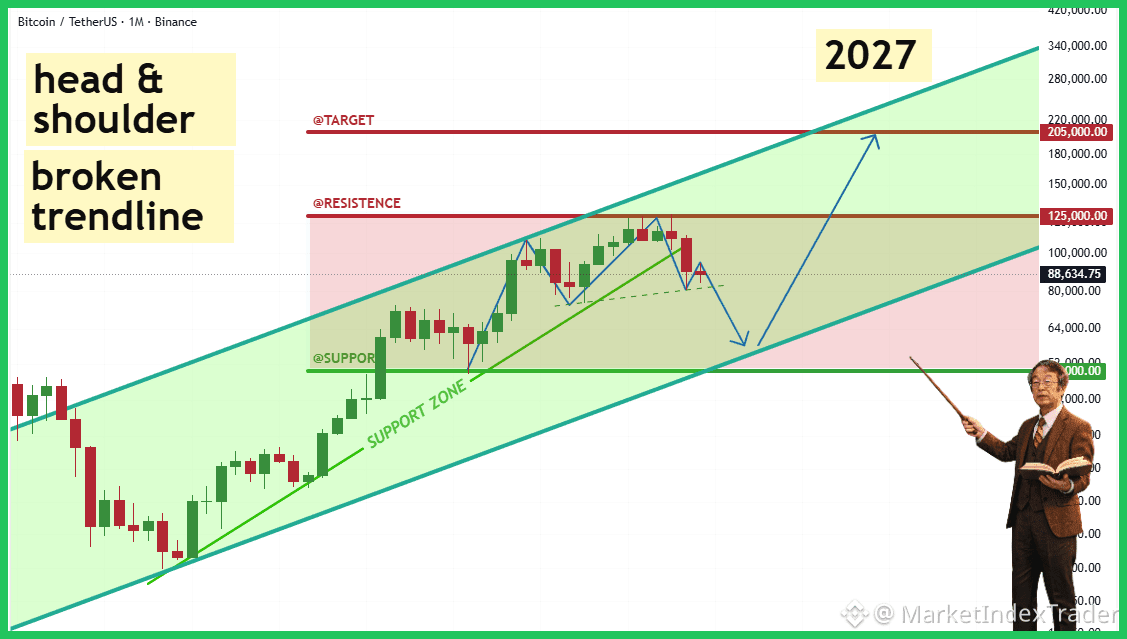
The Bitcoin chart remains locked within a massive ascending channel. However, the price action over the past year has sketched out a potential Head & Shoulders pattern, suggesting a necessary deep pullback after the recent trendline break. We anticipate a crucial retest of the lower channel boundary, targeting the robust $52,000 to $64,000 Support Zone. This area is the key accumulation zone. If this support holds, the path toward the major resistance at $125,000 and the long-term target of $205,000 (as indicated by the channel ceiling) remains fully valid.
Fundamental View
On the fundamental side, institutional adoption continues unabated. Despite short-term price volatility, positive net inflows into US Spot Bitcoin ETFs provide a powerful demand floor. Moreover, increasing regulatory clarity in key jurisdictions is reducing systemic risk and building strong long-term HODLer conviction.
Action Plan
This projected correction is not the end of the cycle; it is the ultimate buying opportunity within the established macro uptrend. Use this potential dip to aggressively DCA (Dollar-Cost Average) as the price approaches the critical $64k and $52k levels.
Highly recommend HOLD and Stacking $BTC at Binance
Feel free to comment the altcoin you are holding and we will check it for you!
#BTC #TechnicalAnalysis #Crypto #BinanceSquare #Bitcoin #HODL
