The price of Bitcoin approaches 2026 mired in the same tug-of-war between buyers and sellers that kept it at bay until the end of 2025. The price has remained generally stable over the last 30 days with a decrease of about 0.6%, indicating that neither side has taken control.
BTC remains down about 7% year-on-year. This balance of pressures has since turned into a deadlock. However, a movement of 1%, or even 3.5%, could ultimately determine the next trajectory if the right conditions arise.
Buyer and seller pressure.
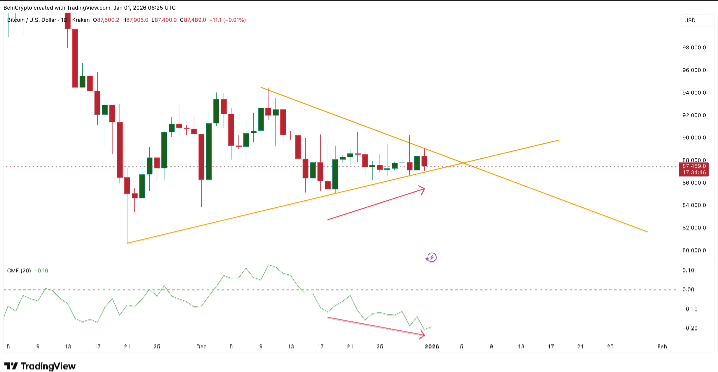
Bitcoin is trading within a symmetrical triangle on the daily chart. This setup shows a market trapped between lower highs and higher lows, illustrating the tug-of-war between buyers and sellers. Capital flows do not support a bullish recovery.
The Chaikin Money Flow (CMF) has been declining since December 10. For those who are unfamiliar, the CMF measures the amount of capital flowing into or out of an asset. A bearish divergence is currently observed, as the price of Bitcoin increased between December 18 and December 31 while the CMF was making lower lows. This signals continued capital outflows and selling pressure.
This negative capital flow is partially offset by outflows from exchanges.
The net position change indicator from exchanges shows coins leaving exchange platforms. This often suggests an accumulation phase. Thus, on December 19, outflows from exchanges were around 16,563 BTC. By January 1, they reached 38,508 BTC.
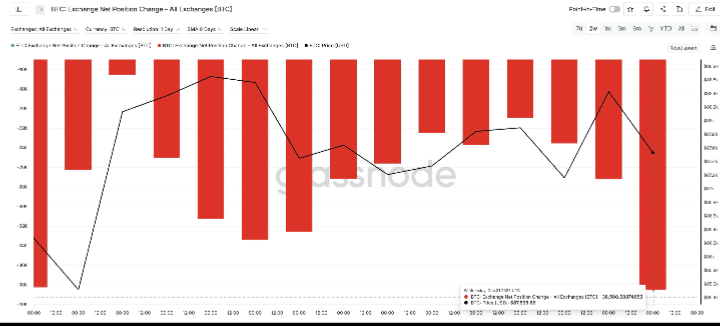
This represents an increase of about 132%. This dynamic regarding coins leaving exchanges contributes to price stability and maintains the upward trend along the lower bound of the triangle.
Smart money shows uncertainty.
The values of the Smart Money Index further confirm this lack of clear direction. The Smart Money Index compares how experienced and informed traders position themselves relative to the rest of the market. The curve is currently stuck to its signal line, with no real separation. This suggests that institutional traders are waiting for a bullish breakout and have not yet taken a position in either direction.
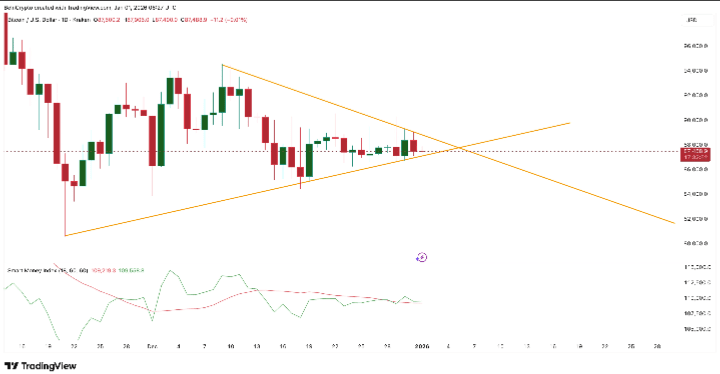
Thus, as long as there is no bullish breakout, the triangle remains neutral.
This corresponds to what the CMF and exchange flow data reveal. Capital outflows signal pressure, while withdrawals from exchanges indicate support. Together, these forces neutralize each other and keep the BTC price balanced. Even the most informed traders struggle to anticipate which side will prevail.
The heat map and price levels reveal a key period.
The heatmap of acquisition cost highlights areas where many buyers last invested. These clusters often act as supports or resistances. The nearest resistance is around $88,082 to $88,459, where approximately 200,035 BTC are positioned.
Bitcoin is trading around $87,480. A daily close about 1% higher would place the price above this area; this could trigger the first bullish signal and validate a breakout above the triangle. On the BTC chart, the level corresponding to this cluster is at $88,300, which must first be crossed.
Downward support levels appear stronger in the short term. The first significant support based on acquisition cost is between $84,449 and $84,845, where nearly 396,645 BTC are clustered.
BTC Support
On the price chart, the nearest level of support based on cost is $84,430. The price of Bitcoin is expected to drop by about 3.5% to test this area. Thus, bearish validation is lower and requires more movement to be confirmed.
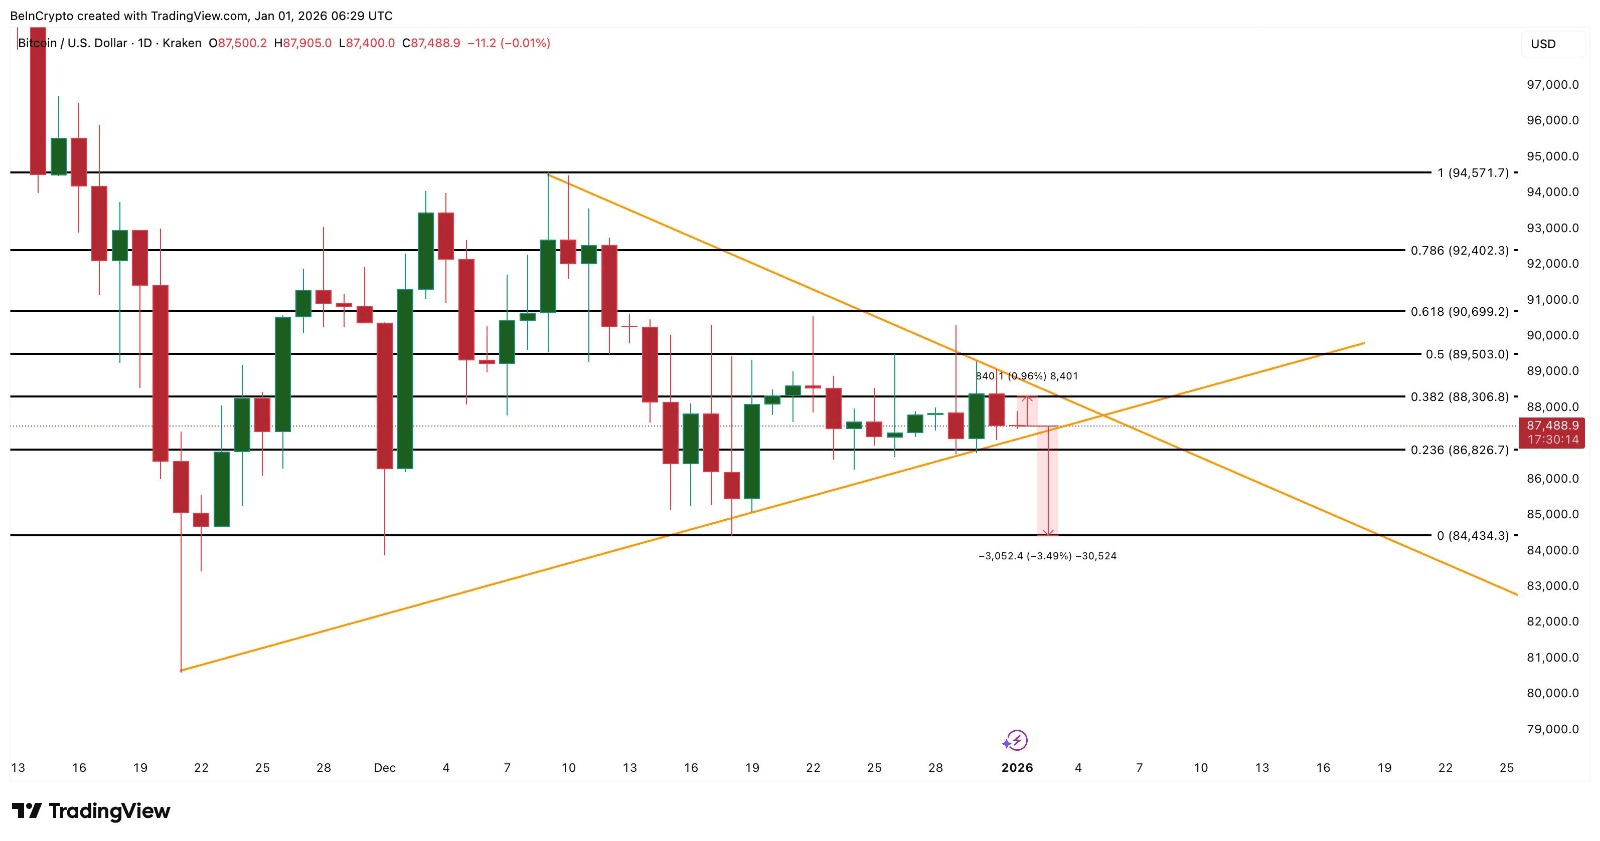
The chart and heatmap are aligned. Exceeding $88,300 thus constitutes the first bullish signal. A clear daily close above this level will shift attention to $89,500, then $90,690. If support at $84,430 is lost, the scenario would completely turn bearish and indicate that sellers have won the battle.
The moral of the story: Bitcoin is not always at its best in winter.
\u003cc-69/\u003e