Hi traders! 👋
Have you ever experienced this?
You see Bitcoin breaking a major resistance. You get excited and buy on the breakout... and suddenly, the price reverses and plummets. 📉
You just got caught in a "Fakeout".
How could you have avoided it? By looking at the market's most honest indicator: Volume.
🔍 What is it and why does it matter?
Volume represents the amount of money and transactions happening at a given moment.
Think of it as the "fuel" of movement:
A car can move downhill without gasoline (inertia), but it won't go far.
To climb a steep hill (resistance), it needs to press the accelerator fully (high volume).
🧠 The Golden Rule: Effort vs. Result
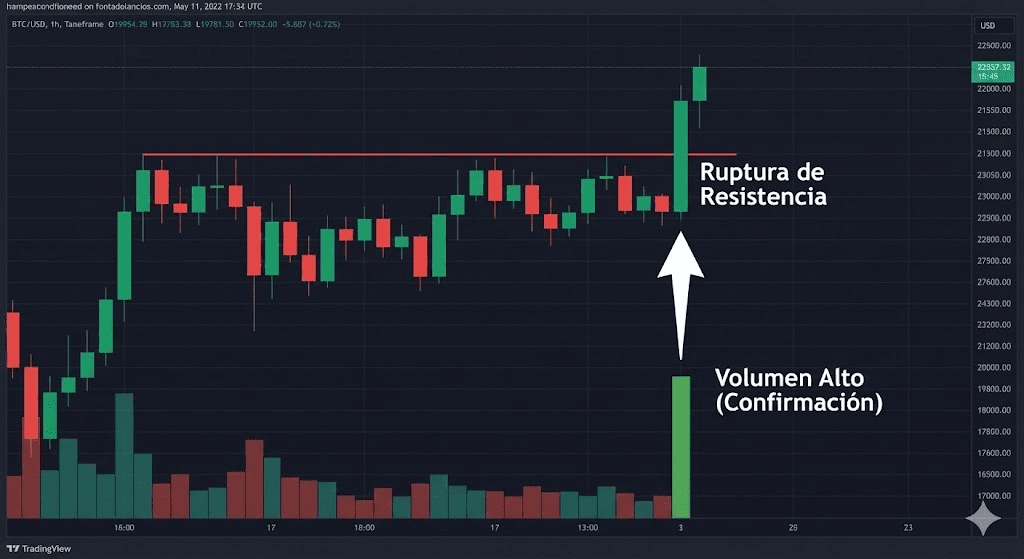
If you see a giant green candle breaking a ceiling, but the volume bars below are small or decreasing, WATCH OUT! ⚠️
That means there's no real institutional interest. It's a trap for retail traders.
For a breakout to be reliable, it must be accompanied by a surge in volume. This confirms that "whales" are pushing the price.
🛠️ Step-by-step to avoid traps:
Turn on the "Volume" indicator on your chart (usually the colored bars at the bottom).
When you see the price approaching a key level (support or resistance), look below.
Does the breakout occur with a volume bar higher than the previous ones? ✅ Likely genuine.
Does the price break but the volume is "sleeping"? ❌ Suspect. It's better to wait for a retest.
📝 Daily Task
Go to the $BNB o $BTC chart. Look for a recent strong drop or rise. What was the volume like at that time? High or low?
💬 Quick question: Do you usually check volume before entering, or do you only look at candles? Be honest in the comments! 👇
Educational content. Technical analysis uses probabilities, not certainties. Always manage your risk.


$BTC $BNB #TradingEducation #VolumeAnalysis #TechnicalAnalysis #CryptoTips #BinanceSquare