This article aims to simply explain liquidity and other relevant information so that each investor learns to observe before investing.
Let's move forward:
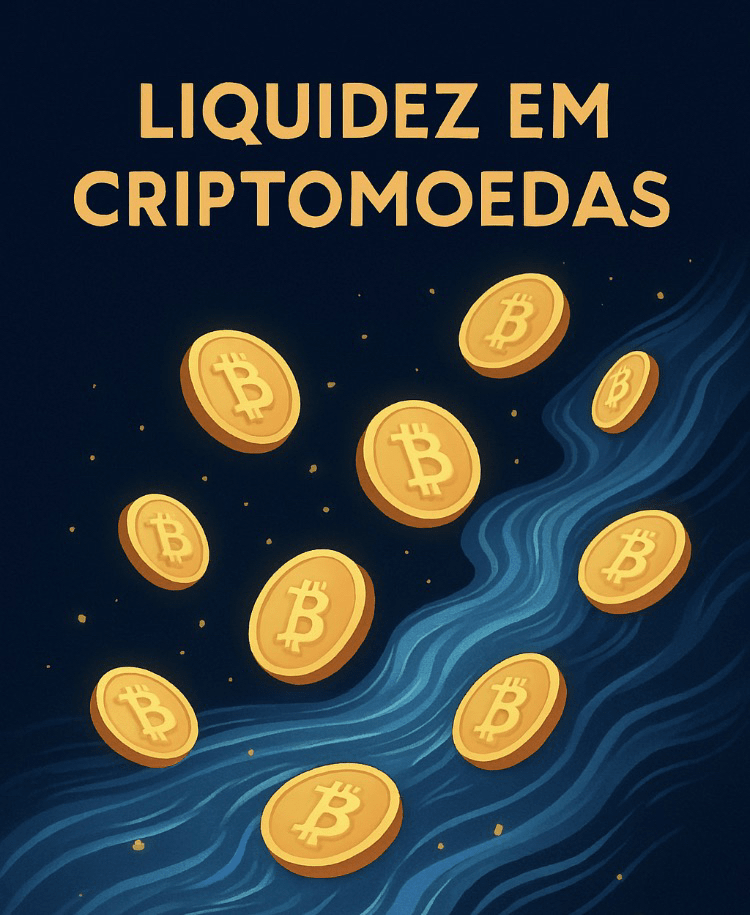
Liquidity in cryptocurrencies is the ease with which you can buy or sell an asset without causing significant price changes.
To interpret charts, it's essential to observe not only the coin's value but also trading volume, price movements (up and down), and market depth.
🔑 What is liquidity in cryptocurrencies?
Definition:
Liquidity is the ability to trade a cryptocurrency quickly and with minimal difference between the buy and sell prices trusteegloba....
High liquidity:
It means there are many active buyers and sellers, making it easy to enter or exit positions.
Low liquidity:
Few participants in the market; large orders can significantly alter the price.
📊 How to read charts?
1. Values/Price:
The price chart shows the evolution of the coin's quote over time.
1.1. Candlesticks (candles):
Each candle represents the opening, closing, highest, and lowest prices during a specific period.
1.2. Trend:
Upward lines indicate an increase; downward lines indicate a decrease.
2. Volume:
Volume indicates how many units of the cryptocurrency were traded during a specific period.
2.1. High volume:
Generally confirms the strength of a trend (upward or downward).
2.2. Low volume:
May indicate lack of interest or risk of manipulation. 🚨
3. Declines and Rises:
3.1. Rise (bullish):
When the price rises alongside increasing volume, it shows confidence in the movement.
3.2. Decline (bearish):
When the price drops with high volume, it indicates selling pressure.
3.3. Corrections:
Small declines within an uptrend may simply be natural adjustments.
4. Depth and Spread:
Order book: Shows buy and sell orders.
4.1. Spread:
The difference between the highest buy price and the lowest sell price. Small spreads indicate good liquidity.
4.2. Depth:
The more orders close to the current price, the more stable the market.
Let's see a practical example, purely illustrative:
💭 Imagine Bitcoin is rising. 🚀
• The chart shows consecutive green candles (price rising).
• Volume also increases, confirming that many investors are participating.
• The spread is small, indicating you can buy or sell without significant losses.
• If volume decreases, even with rising prices, it may be a sign of weakness in the trend.
⚠️ Risks and points to watch:
• Markets with low liquidity may experience price manipulation.
• Artificial volume: Some exchanges inflate numbers to attract investors.
• Slippage: In illiquid assets, the final price of an order may differ from the expected one.
👉 Summarized conclusion:
To interpret cryptocurrency charts, observe price, volume, spread, and depth. Liquidity is the factor that ensures safe and predictable transactions. Other factors we will publish throughout the year 2026.
(STUDY BEFORE INVESTING!)
Best regards from @PORTAL COINJUS
And taking advantage of the 'hook', we continue with our current favorites: $XRP $GRT $ALGO


(NOT FINANCIAL ADVICE)