

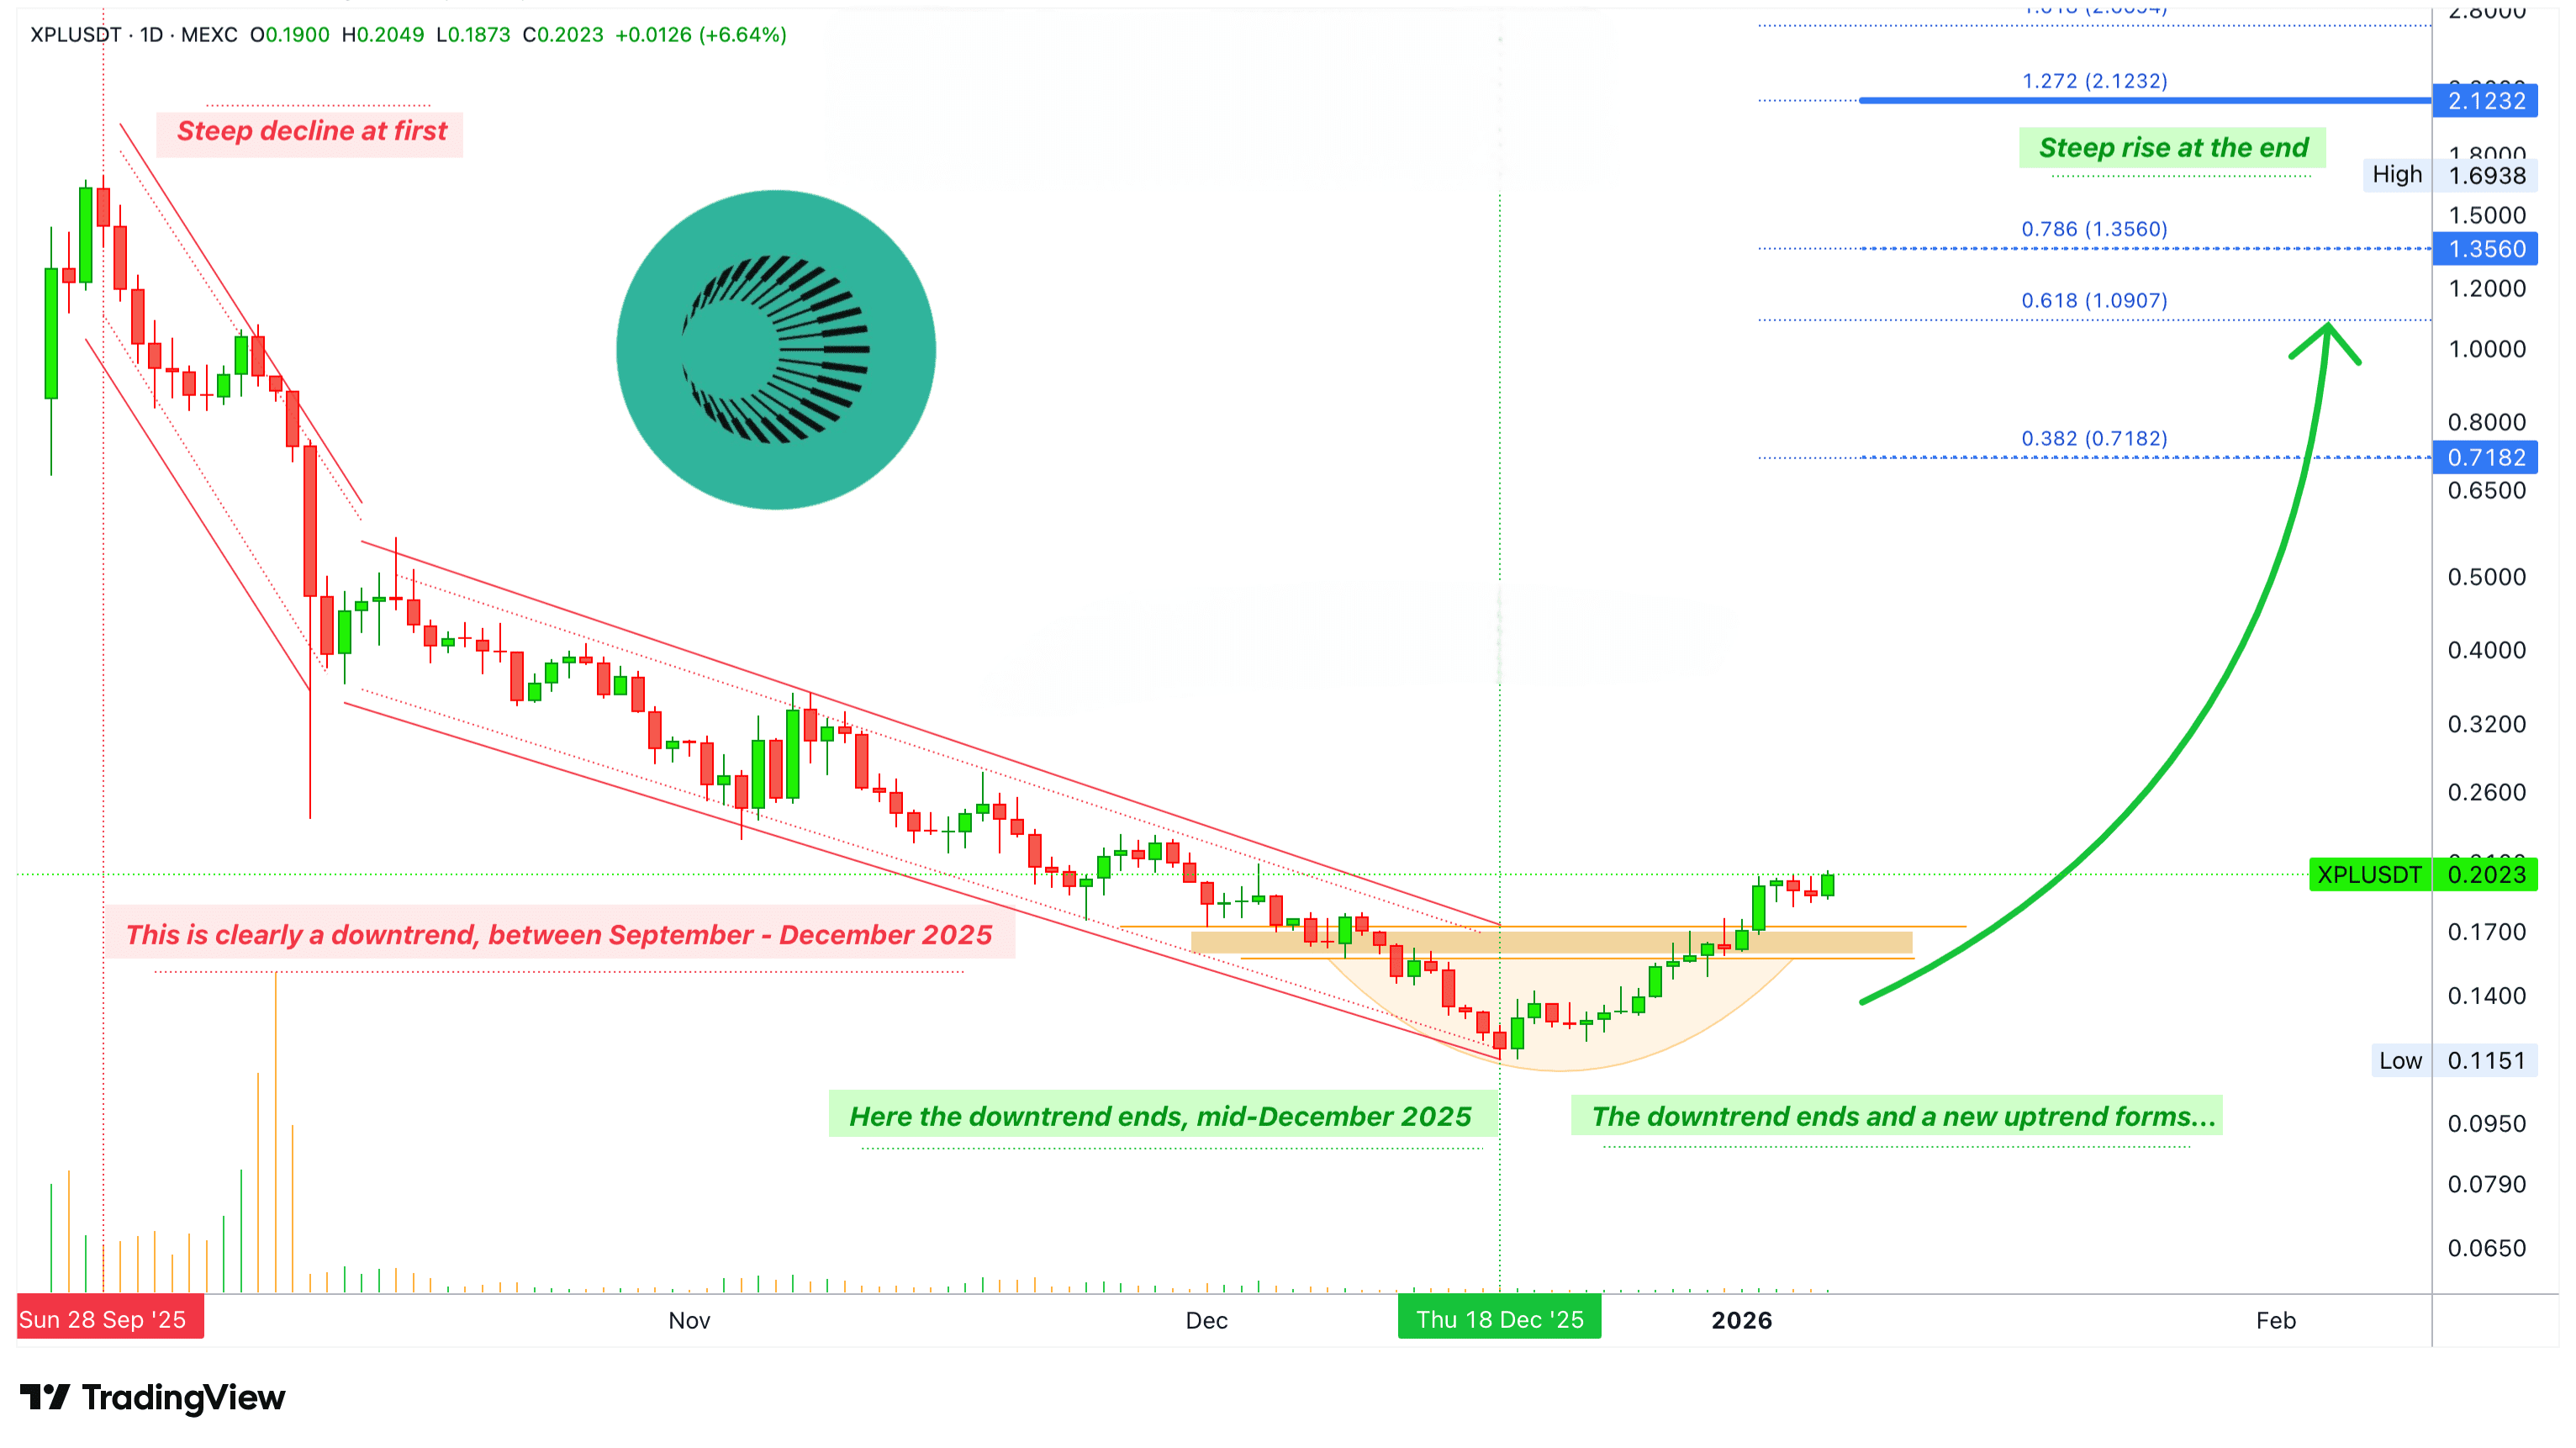
The downtrend begins with a sharp decline. The strength of the downtrend weakens, but the downtrend remains present on the chart until mid-December.
The shift from the downtrend to the uptrend is very strong; in one day, XPLUSDT drops and produces new lows, with many red candles. The next day, most candles are green, with some red candles here and there; the beginning of the uptrend.
The candles on the chart are now forming higher highs, and support is no longer in question. Just as the market continued to move downward while bulls were in control, it will move upward as long as bulls (buyers) remain in control of the market.
The current decline on this chart has lasted for three months. We can expect a similar upward trend, at least three months before a strong correction appears, possibly more but unlikely to be less. It might be slightly less than three months, possibly between 2.5 to 3 months or more.
The rise begins slowly, gradually. As it approaches the end, a sharp rise occurs, a parabolic move, a type of bullish market event. There could be a small rise, a moderate rise, or a massive rise—we remain open to seeing all scenarios unfold. The final move can be of any size, but it is certain to happen.
⚠️ Notice:
This analysis is for educational purposes only and does not encourage trading futures or any prohibited transactions. The purpose is to illustrate potential market movements, not to provide direct buy or sell recommendations.
💡 Important Notes:
- This analysis is for educational purposes only.
- Please study the market and make decisions based on your own risk tolerance and capacity.
- The author is not responsible for others' trading or their profit outcomes.
Namaste.
✅ Trade here on $XPL