Family! Today the spotlight is on Ethereum ($ETH). As a Sui Builder, my focus is on efficiency and pure data. Forget the noise; let's go straight to what matters in the 1H chart.
📈 ETH/USDT Chart (1-Hour Candles)
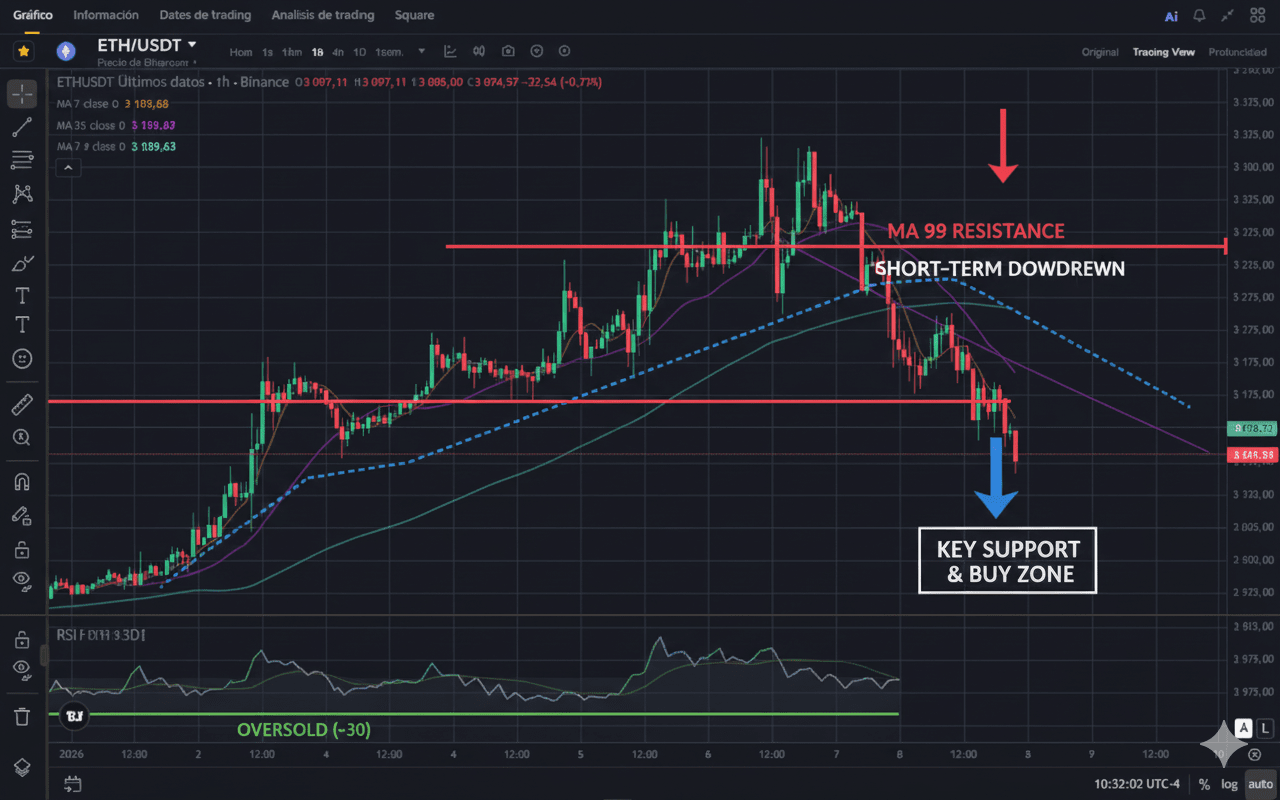
Strategy: EMA 200 + RSI
Current Situation: $ETH
EMA 200 (Yellow Line): Our dynamic trend support.
What do we see? The price is ABOVE the EMA 200. This maintains a healthy intraday bullish trend. Good signal!
RSI (Oversold Indicator): Measures the strength of the move.
What do we see? The RSI has just touched the 30 zone (oversold) and is showing a slight upward turn. Combined with the 200 EMA support, this activates a potential buying zone.
✔️ My Action Plan (January 8):
Active Buying Zone: If ETH holds above $3,080 and RSI bounces from 30, we could consider entering with a stop loss placed just below $3,000.
Target (Take Profit): We would aim for $3,200 - $3,250 (Intraday Resistance).
Monitoring: If the price breaks and closes BELOW the 200 EMA ($3,080), this buying plan becomes invalid, and we will look for possible shorts or wait for new confirmations.
Remember: discipline is key. Don’t trade out of emotion!
Are you ready for action or would you prefer to wait? I’ll read your comments below. 👇
#Write2Earn #ETH #Ethereum #EMA200 #RSI $ETH