
📰 Daily Market Update:
Today’s market data from Binance on-chain indicators is sending mixed signals.
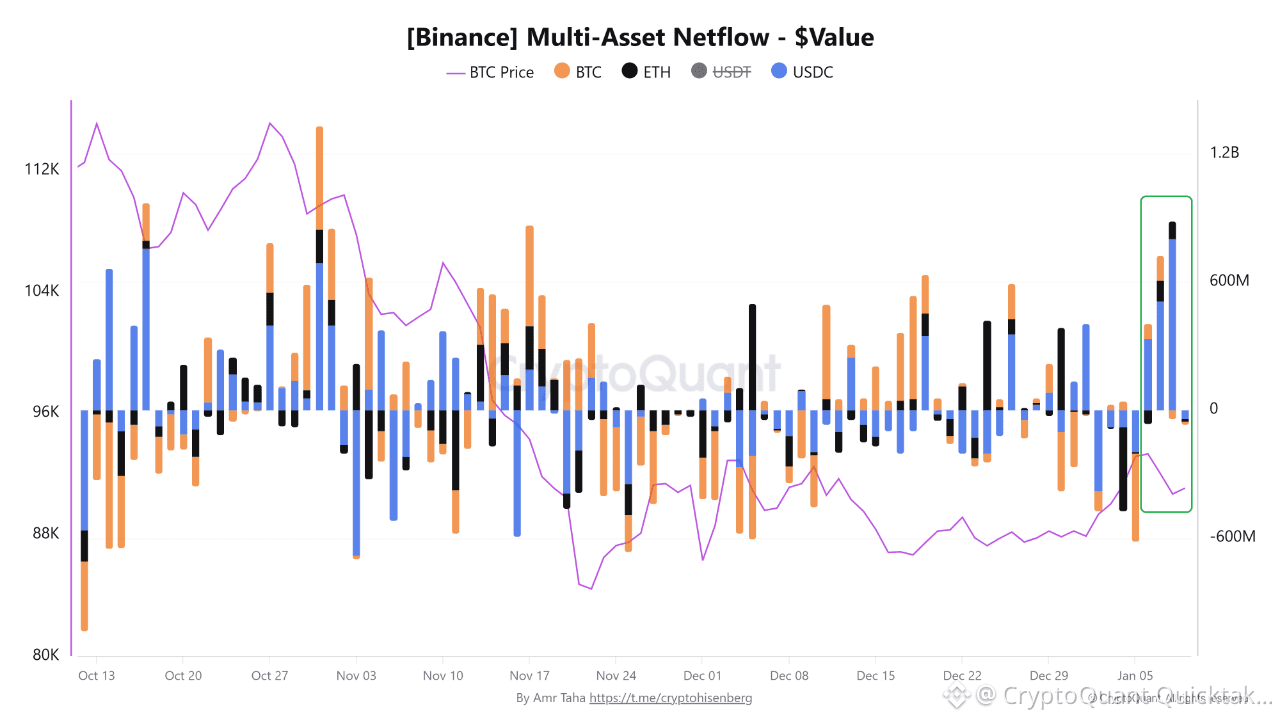
📊 [Binance] Multi-Asset Netflow — $Value
This chart tracks daily netflows (USD value) of multiple assets moving into and out of Binance.
📈 Positive netflow → More deposits than withdrawals (capital moving to exchanges)
📉 Negative netflow → More withdrawals than deposits (capital leaving exchanges)
🔬Key Observations:
USDC recorded 3 consecutive days of strong positive netflows
💵 Jan 6: +$300M
💵 Jan 7: +$500M
💵 Jan 8: +$800M+
📌 What makes this more important is that we saw a very similar setup in mid-October, shortly before Bitcoin dropped from $109,000 to below $85,000.
This doesn’t mean price must dump again, but it clearly shows capital is being parked on exchanges, not deployed yet.
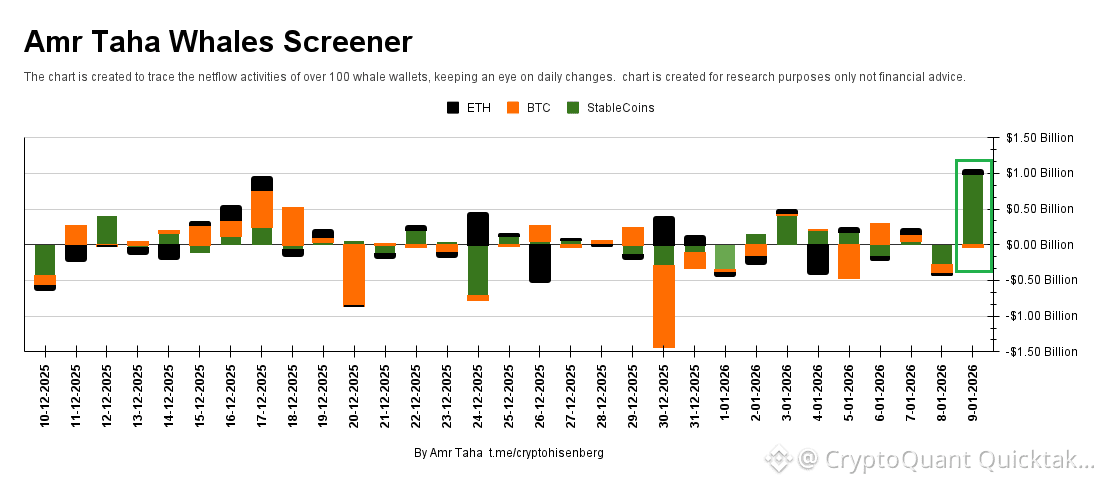
📊 Whales Screener – BTC, ETH, Stablecoin Netflows
The Whales Screener tracks real-time deposits and withdrawals of Bitcoin, Ethereum, and Stablecoins from over 100 actively monitored whale wallets — spot market only.
* The majority of inflows to spot exchanges are dominated by stablecoins.
* Deposit activity for Stablecoins increased noticeably today.
* Stablecoins recorded the largest deposit activity, reaching nearly $1 billion.
* This behavior usually indicates preparation for making a purchase.
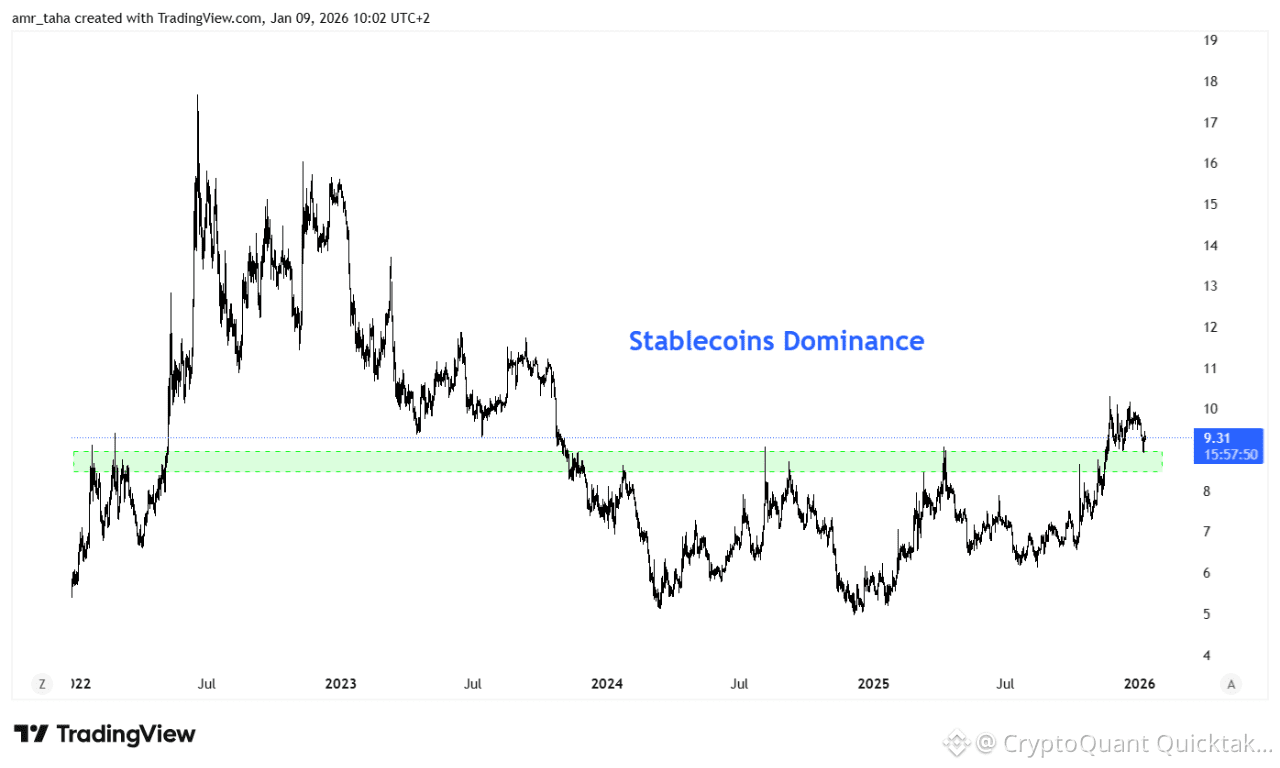
📊 Stablecoins Dominance
The Stablecoins Dominance chart measures the percentage of stablecoins compared to the total crypto market.
* Rising dominance → more selling than buying
* Falling dominance → capital rotating into crypto assets
📌 Right now:
* Stablecoins dominance is holding above 9%
* The daily chart has not closed below 9%
As long as dominance stays elevated, upside momentum for BTC remains limited.
🧠 Final Thoughts
increasing stablecoin balances on spot exchanges can sometimes be bullish (dry powder for future buys),
rising stablecoin dominance usually tells a different story.
Written by Amr Taha