

For traders who are still new in the market, reading trading data can feel confusing at first. But if you slow down and really look, the story becomes more clear. This 15-minute trading data for Walrus ( $WAL ) gives some useful hints about what is happening behind the price.
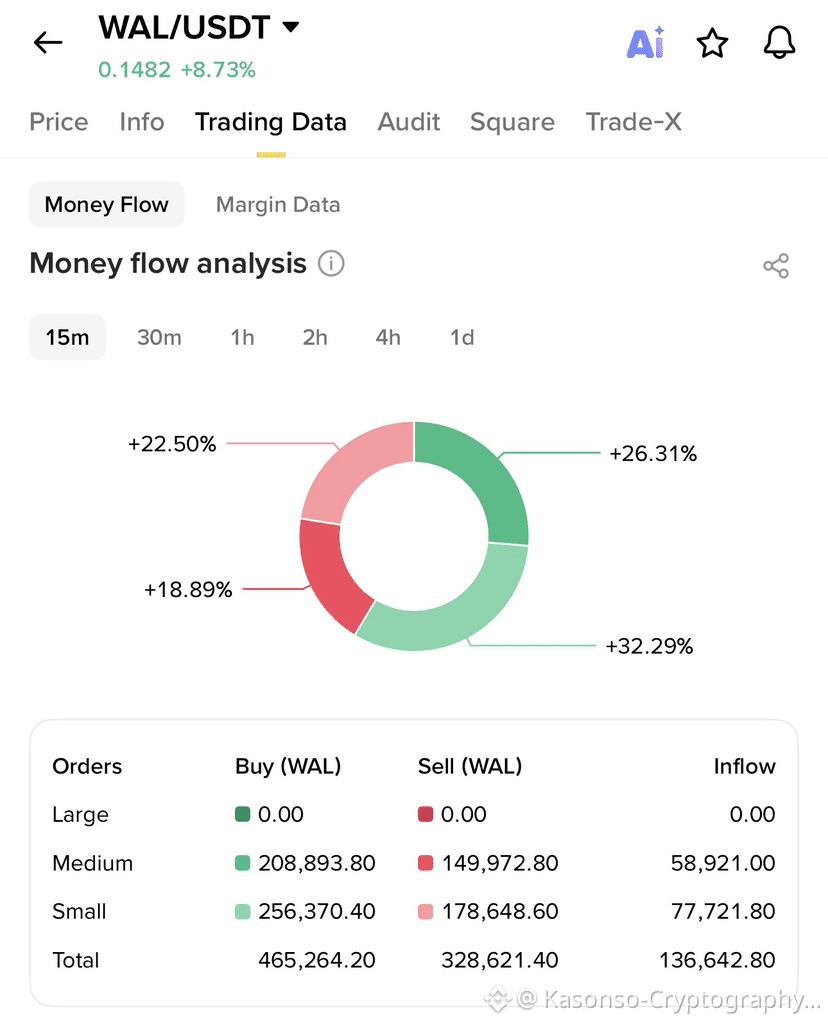
First thing you notice is the money flow circle. The green areas are bigger than the red ones, and that alone already tells us buyers are slightly stronger than sellers in this short time frame. It doesn’t mean price will pump hard immediately, but it shows interest is still there. Many beginners think red means danger always, but small red is normal in healthy market moves.
Looking at the orders section, there are no large orders showing up right now. That means whales are quiet at the moment. Most of the activity is coming from medium and small traders. Medium buys are clearly higher than medium sells, and the same thing happens with small orders. This is usually a sign of gradual accumulation, not panic selling.
The inflow number is also positive, which means more money is entering than leaving. For beginners, this is important. Positive inflow during a pullback often shows people are buying the dip instead of running away.
Walrus at this stage looks like it’s just cooling off, not collapsing. The 15-minute data suggests calm accumulation and patience. Sometimes the market rewards those who wait, not those who rush every candle.