

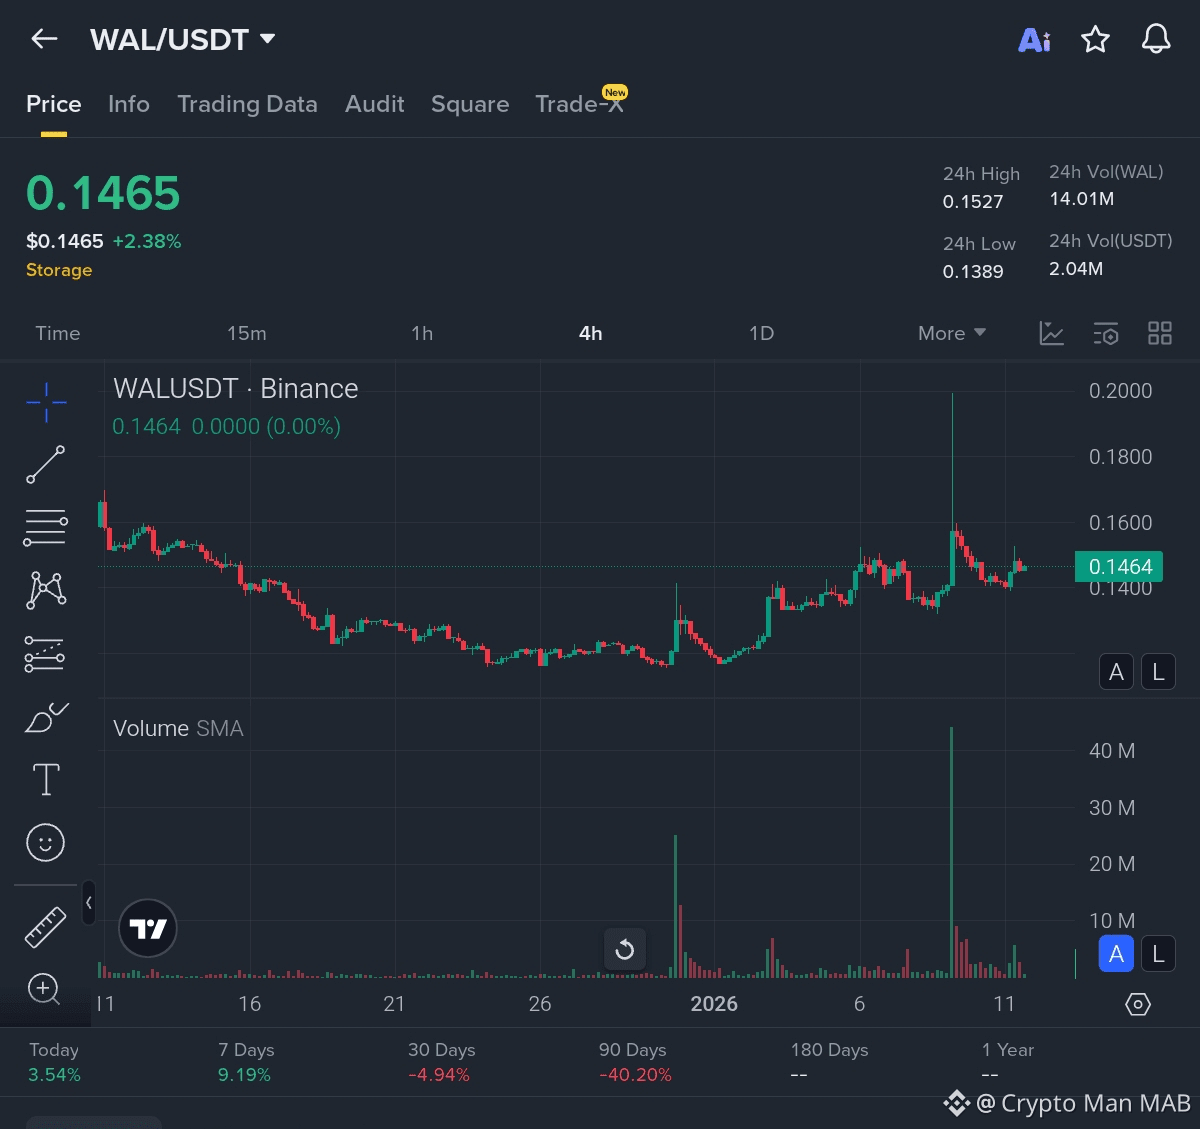
WAL/USDT pair on a longer timeframe (likely 1D or higher, spanning late 2025 into 2026).
Key Price Levels & Recent Action
Current price - [?] $0.1465 (up +2.38% in the last 24h)
24h range - Low: $0.1389 High: $0.1527
24h volume - ~14M WAL (decent liquidity for a mid-cap token)
From the chart:
WAL experienced a significant downtrend through much of late 2025/early 2026 after an all-time high around $0.75-0.87 (likely in March-May 2025, shortly after launch/listing in October 2025).
It bottomed near $0.11-0.12 in late December 2025 / early January 2026.
Since then, we've seen a clear recovery/rebound phase:
- Sharp volume spike and strong green candle pushing price up aggressively around early January 2026 (visible as the tall volume bar and price jump to ~$0.16+).
- Followed by consolidation/pullback with lower highs, forming what looks like a higher low structure.
- Recent action shows price bouncing off support near $0.14, with the latest candle showing bullish momentum (+2.38%).
Overall Trend & Patterns
Longer-term (90 days+) - Still down ~40%, reflecting post-launch correction typical for many new projects.
Short/medium-term (last 7-30 days) - Bullish reversal signs:
- Higher lows forming.
- Increased volume on up moves (especially the big spike).
- Price reclaiming above some previous resistance-turned-support levels (~$0.14).
This resembles a potential bottoming process or early stage of a recovery rally, especially after heavy selling pressure eased.
Volume Insights
Volume has been relatively low during the downtrend/consolidation but spiked dramatically on the recent upward move -- classic sign of buying interest returning. The large green volume bar suggests accumulation or short covering.
Broader Context (January 2026)
Market data across sources shows WAL trading in the $0.14-$0.15 range today, with mixed short-term predictions (some neutral/flat, others expecting mild upside or volatility). The token has shown resilience with +3-9% gains over the past week in various reports, amid broader crypto recovery vibes.
Summary & Outlook
Short-term bullish bias -- the chart shows signs of reversal from December lows, with momentum building and volume supporting buyers. If price holds above $0.14 and breaks $0.1527 (recent high), we could see a push toward $0.16-$0.18 as next resistance.
Risks remain -- It's still well below ATH, and crypto (especially newer Sui ecosystem tokens) can be volatile. Watch for rejection at $0.15-$0.1527 or breakdown below $0.1389 as invalidation.
This is not financial advice -- always DYOR and consider market conditions! If you'd like a deeper dive into specific indicators (e.g., RSI, MA crossovers) or comparison with Sui ecosystem peers, let me know.