

In the context of a crypto market in moderate risk-on mode, Chainlink price today (LINK/USDT) is moving in a delicate technical area, caught between a credible rebound and an underlying trend that remains fragile.
Chainlink price today (LINK/USDT): 13.95 USDT
Chainlink is currently moving in a tricky zone: strong enough to talk about a credible rebound, yet too weak to claim that the underlying bearish trend is truly behind us. The broader crypto macro context is supportive, with total market cap rising and volatility increasing, but LINK remains below its 200-day moving average, still under the long-term 'trend line'
The basic picture on the daily (D1) is slightly bullish in the short term, but positioned in a still corrective medium-term structure. In practice, the market is trying to push higher, however, it is doing so counter to the dominant trend of recent months.
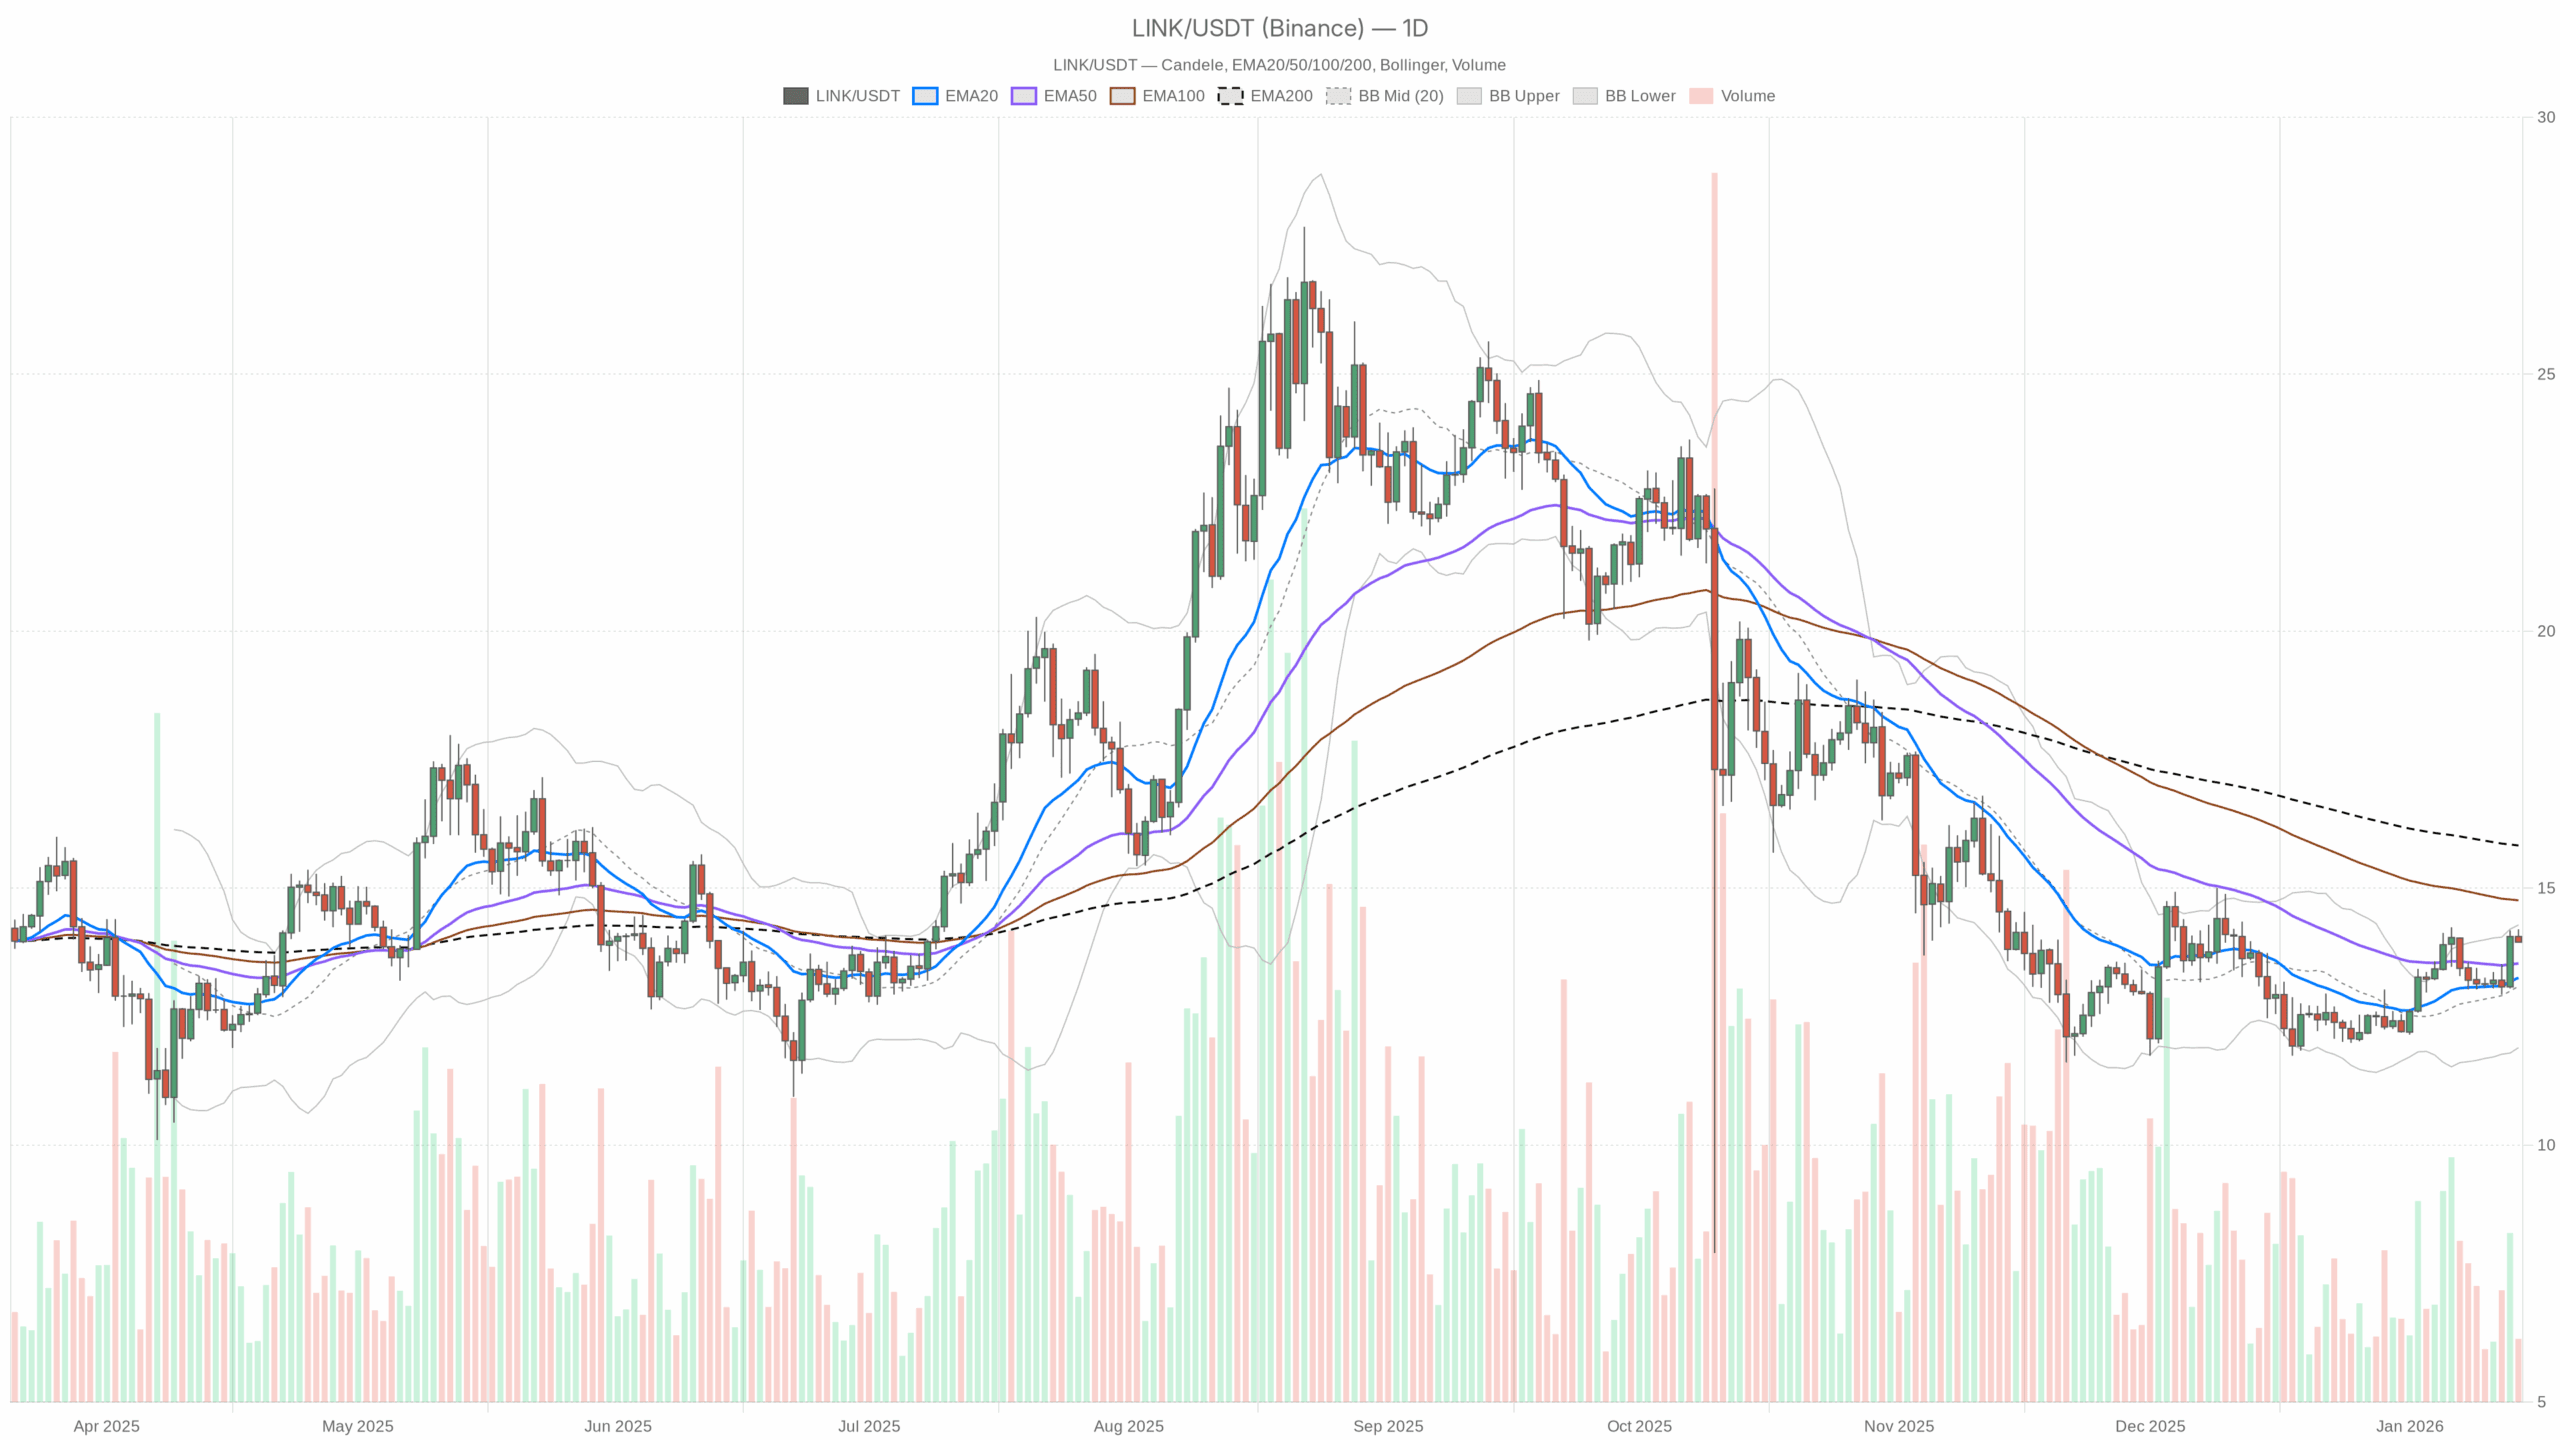 LINK/USDT — daily chart with candlesticks, EMA20/EMA50 and volume.
Main bias on D1: bullish rebound within a still weak trend
Let's start from the daily timeframe, which gives us the underlying direction:
D1 Chainlink price today: 13.95 USDT
D1 regime: neutral
Although the model classifies it as 'neutral', the asset is working above the short averages and below the long-term average. It is the typical asset rebounding after a phase of weakness. Until it stabilizes above the 200-day, speaking of a new structural bull market remains premature.
EMA (20, 50, 200) – rebound, but the 200-day remains the wall
D1 Data:
Price: 13.95
EMA 20: 13.26
EMA 50: 13.54
EMA 200: 15.83
What it means: LINK is quoted above the 20 and 50 days, but still well below the 200. The market is rewarding the short term, with a rebound underway, but has not yet overturned the structural picture. In other words, the flow is clear: short-term traders buy the lows, while medium and long-term investors are not yet fully convinced.
Daily RSI – moderate strength, not euphoria
D1 Data: RSI 14 at 59.93.
What it means: the RSI is moving in the high neutral range, close to the strength threshold but still far from excess zones. The market is accumulating bullish pressure, but is not in full FOMO. Consequently, there is room for the movement to continue without necessarily requiring an immediate correction.
Daily MACD – bullish momentum strengthening, but not explosive
D1 Data:
MACD line: 0.18
Signal: 0.07
Histogram: 0.10 (positive)
What it means: the MACD is in positive territory with a green histogram, indicating that the momentum is favoring buyers. The signal is not extreme; it's more of a 'healthy bullish trend but not parabolic.' This is usually compatible with grind-up phases, progressive but not vertical climbs.
Bollinger Bands D1 – price towards the upper part of the range
D1 Data:
Mid band: 13.09
Upper band: 14.29
Lower band: 11.90
Price: 13.95
What it means: LINK is trading near the upper band, inside but at the top of the channel. This is where take profits from those who bought lower usually concentrate, but as long as the price remains stuck in the high zone, the message is simple: operational control remains in the hands of buyers.
Daily ATR – contained volatility, room to expand
D1 Data: ATR 14 at 0.56.
What it means: the average daily volatility is moderate in relation to the price around 14 USDT. We are not in a panic or euphoria phase. However, a directional acceleration is enough to quickly widen the range. Those working with significant sizes must keep in mind that a daily range of 3–4% falls within the normality of the asset at this stage.
Daily pivots – area 14 as the intraday dividing line
D1 Data:
Pivot point (PP): 14.03
Resistance R1: 14.12
Support S1: 13.86
What it means: the price today (13.95) is oscillating just below the daily pivot at 14.03. The area 14-14.10 is the intraday dividing line. Above, the market sends a confirmation signal for the rebound; below, the idea of consolidation or profit-taking prevails more than that of a breakout.
H1: momentum still bullish, but in a breathing phase
On the hourly timeframe (H1) the model classifies the regime as bullish. Here the story is of a short-term bullish trend that is beginning to slow down and breathe, without yet having inverted.
H1 EMA – short trend still positive
H1 Data:
Price: 13.94
EMA 20: 13.90
EMA 50: 13.64
EMA 200: 13.38
What it means: the price is above all the main hourly averages, with a structure inclined, that is, 200 < 50 < 20 < price. This is a classic asset in a short-term bullish trend. Those who work on the daily find in this H1 an ally, not an enemy.
H1 RSI – strength but no excessive fatigue
H1 Data: RSI 14 at 58.01.
What it means: here too RSI is in the high but not extreme zone. The short trend still has room, but any further upward leg without pauses will begin to increase the risk of more aggressive pullbacks.
H1 MACD – first sign of cooling
H1 Data:
MACD line: 0.16
Signal: 0.19
Histogram: -0.03 (slightly negative)
What it means: in the short term, momentum is starting to lose a bit of steam. The slightly negative histogram often anticipates phases of lateral consolidation or small corrections, rather than deep reversals. It is a signal of slowing down, not yet of trend change.
Bollinger Bands H1 – price centered, market in balance
H1 Data:
Mid band: 13.94
Upper band: 14.32
Lower band: 13.57
Price: 13.94
What it means: the price is practically at the central band. After pushing upwards, LINK is now stabilizing the push, with a market seeking a new equilibrium before deciding the next impulsive direction.
H1 ATR – manageable intraday volatility
H1 Data: ATR 14 at 0.14.
What it means: the average range for the hourly candle is limited, a sign of a relatively orderly order book. Sudden movements are always possible; however, at this stage, micro-adjustments dominate more than sharp movements.
H1 Pivot – very narrow micro-range
H1 Data:
Pivot point (PP): 13.97
R1: 13.99
S1: 13.91
What it means: the price at 13.94 is stuck in a micro-range between 13.91 and 13.99. It is a compression phase that usually does not last long. The decisive break of one of these extremes, if accompanied by volume, tends to determine the direction of the movement for the next hour or part of the session.
15 minutes: structure still constructive, but momentum cooling
The 15 minutes only serves to understand the timing, not the underlying trend. Here the picture clearly shows a market that has run and is now catching its breath.
M15 EMA – price above the 200, but below 20 and 50
M15 Data:
Price: 13.95
EMA 20: 14.04
EMA 50: 13.99
EMA 200: 13.63
What it means: in the very short term, the price has returned below the faster averages, but remains above the 200. It is the classic pullback within a trend still intact at the structural level. It is not a sign of collapse; it is more of a 'the market needs to digest the previous movement.'
M15 RSI – brief bearish pressure
M15 Data: RSI 14 at 36.88.
What it means: the RSI has moved into the low range, signaling very short selling pressure. This is consistent with a micro-pullback. As long as it does not enter deeply oversold, we are talking more about an opportunity for absorption than a structural reversal.
M15 MACD – slight bearish momentum
M15 Data:
MACD line: -0.01
Signal: 0.00
Histogram: -0.02
What it means: the 15 minutes is unloading some of the bullish excess, with a slightly negative MACD. Here, the most likely scenario is still that of a consolidation phase or contained pullback, not of a deep reversal of the daily trend.
Bollinger Bands M15 – price on the central band
M15 Data:
Mid band: 14.05
Upper band: 14.14
Lower band: 13.96
Price: 13.95 (slightly below the lower band just touched)
What it means: the price has moved towards the lower limit of the bands in the very short term, signaling a mini excess to the downside after the pullback. Generally, when the daily trend remains constructive, these dips on the 15 minutes are frequently absorbed.
M15 ATR and pivot – low micro-volatility, scalper market
M15 Data:
ATR 14: 0.05
Pivot point (PP): 13.95
R1: 13.96
S1: 13.94
What it means: the average range of each 15-minute candle is very narrow, as is the pivot corridor. It is a market of micro-movements, more suitable for those who work in scalping than for those looking for significant directional swings on this timeframe.
Macro context: moderate risk-on, but high BTC dominance
On the macro front, the total crypto market cap is around $3.32 trillion, up about 3.23% in the last 24 hours, with volumes increasing by almost 50%. The market mood, with the fear & greed index at 48, is neutral: no panic and no euphoria.
Bitcoin's dominance above 57% indicates that a large part of the flow is still directed towards the big names. For an alt like Chainlink, this usually means possible but selective rebounds. Altcoins are rewarded especially if they have a strong narrative and clear technical levels. At this moment, LINK has a constructive technical structure, but is not yet leading the rotation of the alt market.
Bullish scenario on Chainlink price today
The bullish scenario is already underway in the short term, but needs confirmation to become something more than just a technical rebound. That is why price behavior in the coming sessions will be crucial.
What needs to happen to strengthen the bull case:
Stable recovery above the daily pivot at 14.03 and holding above 14.10–14.20 in the next sessions.
Maintaining price above the daily EMA 20 and 50, with the two averages starting to clearly tilt upwards.
D1 RSI stabilizing above 60–65 without immediately exploding into overbought, a sign of a healthy trend.
D1 MACD continues to widen the positive histogram, meaning momentum is strengthening, not just a temporary bounce.
Technical targets in case of bullish continuation:
First working zone: area 14.30–14.50, near the upper D1 band, where profit-taking often begins.
Key medium-term level: daily EMA 200 around 15.80–16.00. A reconquest and hold above this area would really change LINK's narrative from rebound to structural restart.
When the bullish scenario would start to creak:
Return below the area 13.50–13.60, that is, back below the daily EMA 50.
D1 RSI that returns to the 50 area or less, signaling that the push was only temporary.
D1 MACD that closes the histogram and returns flat or negative in a few sessions.
Bearish scenario on Chainlink price today
The bearish scenario, at the moment, is more a potential risk than a reality on the daily chart. The short term is working in favor of buyers, but being below the 200-day reminds us that the underlying trend has not yet been convincingly reversed.
How the short side could reactivate:
Loss of daily support S1 at 13.86 with follow-through, that is, not only an intraday break but closures below that level.
Breaking in sequence EMA 20 at 13.26 and then area 13.00–13.10, in line with the mid band of the Bollinger D1.
D1 RSI sliding towards 45 and below, showing that the strength phase has been rejected.
D1 MACD returning towards zero and then breaking it down.
Technical targets in case of bearish scenario:
Zone 12.00–12.20 as the first natural landing area in case of a more decisive correction.
In scenarios of greater weakness in the overall crypto market, it would not be surprising to see tests towards the lower D1 band, around 11.90, as an extension of the movement.
What would invalidate the bear case in the short term:
Stabilization above 14.30 with D1 RSI strengthening.
Clear alignment of all EMAs, with 20 > 50 > 200 and price above. At that point, the underlying trend would change skin.
How to read Chainlink today in terms of positioning
Chainlink today is in an interesting gray area: the short is in favor of buyers, the long remains suspended. Those looking at the market with a swing perspective may interpret the situation as an advanced technical rebound but not yet mature enough to speak of a consolidated bull trend.
Two key operational awareness:
The area 14–14.30 is the immediate crossroads: there lies the difference between a simple rebound and a short-term breakout attempt.
The area 15.50–16.00, corresponding to the D1 EMA 200, is the frontier of the medium term. Without a credible reconquest of that area, every rally remains potentially sellable for those thinking in long timeframes.
Volatility at the moment is manageable both on D1 and H1, but can expand rapidly if the price breaks key levels with high volumes, especially in an overall strong crypto market but with high BTC dominance. In practice, the ground is favorable for explosive movements, but it is not guaranteed that they will favor LINK if the flow continues to favor the big caps.
In any case, Chainlink price today remains at the center of an important game right around current levels. The direction it will take with respect to 14.00–14.30 in the coming sessions will help to understand whether it is just a brief rebound or the beginning of something more substantial.
Trading Tools
If you want to monitor markets with professional charting tools and real-time data, you can open an account on Investing using our partner link:
Open your Investing.com account
This section contains a sponsored affiliate link. We may earn a commission at no additional cost to you.
Disclaimer: The considerations reported are for informational and editorial purposes only and do not in any way represent a recommendation or solicitation for investment. The cryptocurrency market is highly volatile and speculative: those who operate do so at their own exclusive risk, having carefully evaluated their objectives, financial situation, and risk tolerance.