Bitcoin has now entered a significant turning zone. Many traders have become fearful after observing recent price action, but the technical signals tell a different story.
📉 RSI Oversold: Prothom Strong Signal
Bitcoin's 4H timeframe RSI has now entered the oversold zone, which is a very rare event. This kind of RSI level has only been seen a few times in the last few months, and each time it has been followed by a bullish bounce.
When RSI becomes oversold like this, it indicates that the sell pressure is gradually weakening.
🔻 Bearish momentum is decreasing
On January 15, the highest sell volume was seen in Bitcoin. However, recently, even though the price has made a new low, the volume is not as strong as before.
What does it mean?
👉 Sellers are exhausted
👉 Downtrend weak
This divergence usually signals a trend reversal.
🟥 6 Days of Consecutive Red Candle – History Repeat?
Bitcoin has seen very few instances of 5 or more consecutive red candles in its history.
Last time when there were 6 consecutive reds, the market rebounded strongly the next day.
Now the same pattern is forming again.
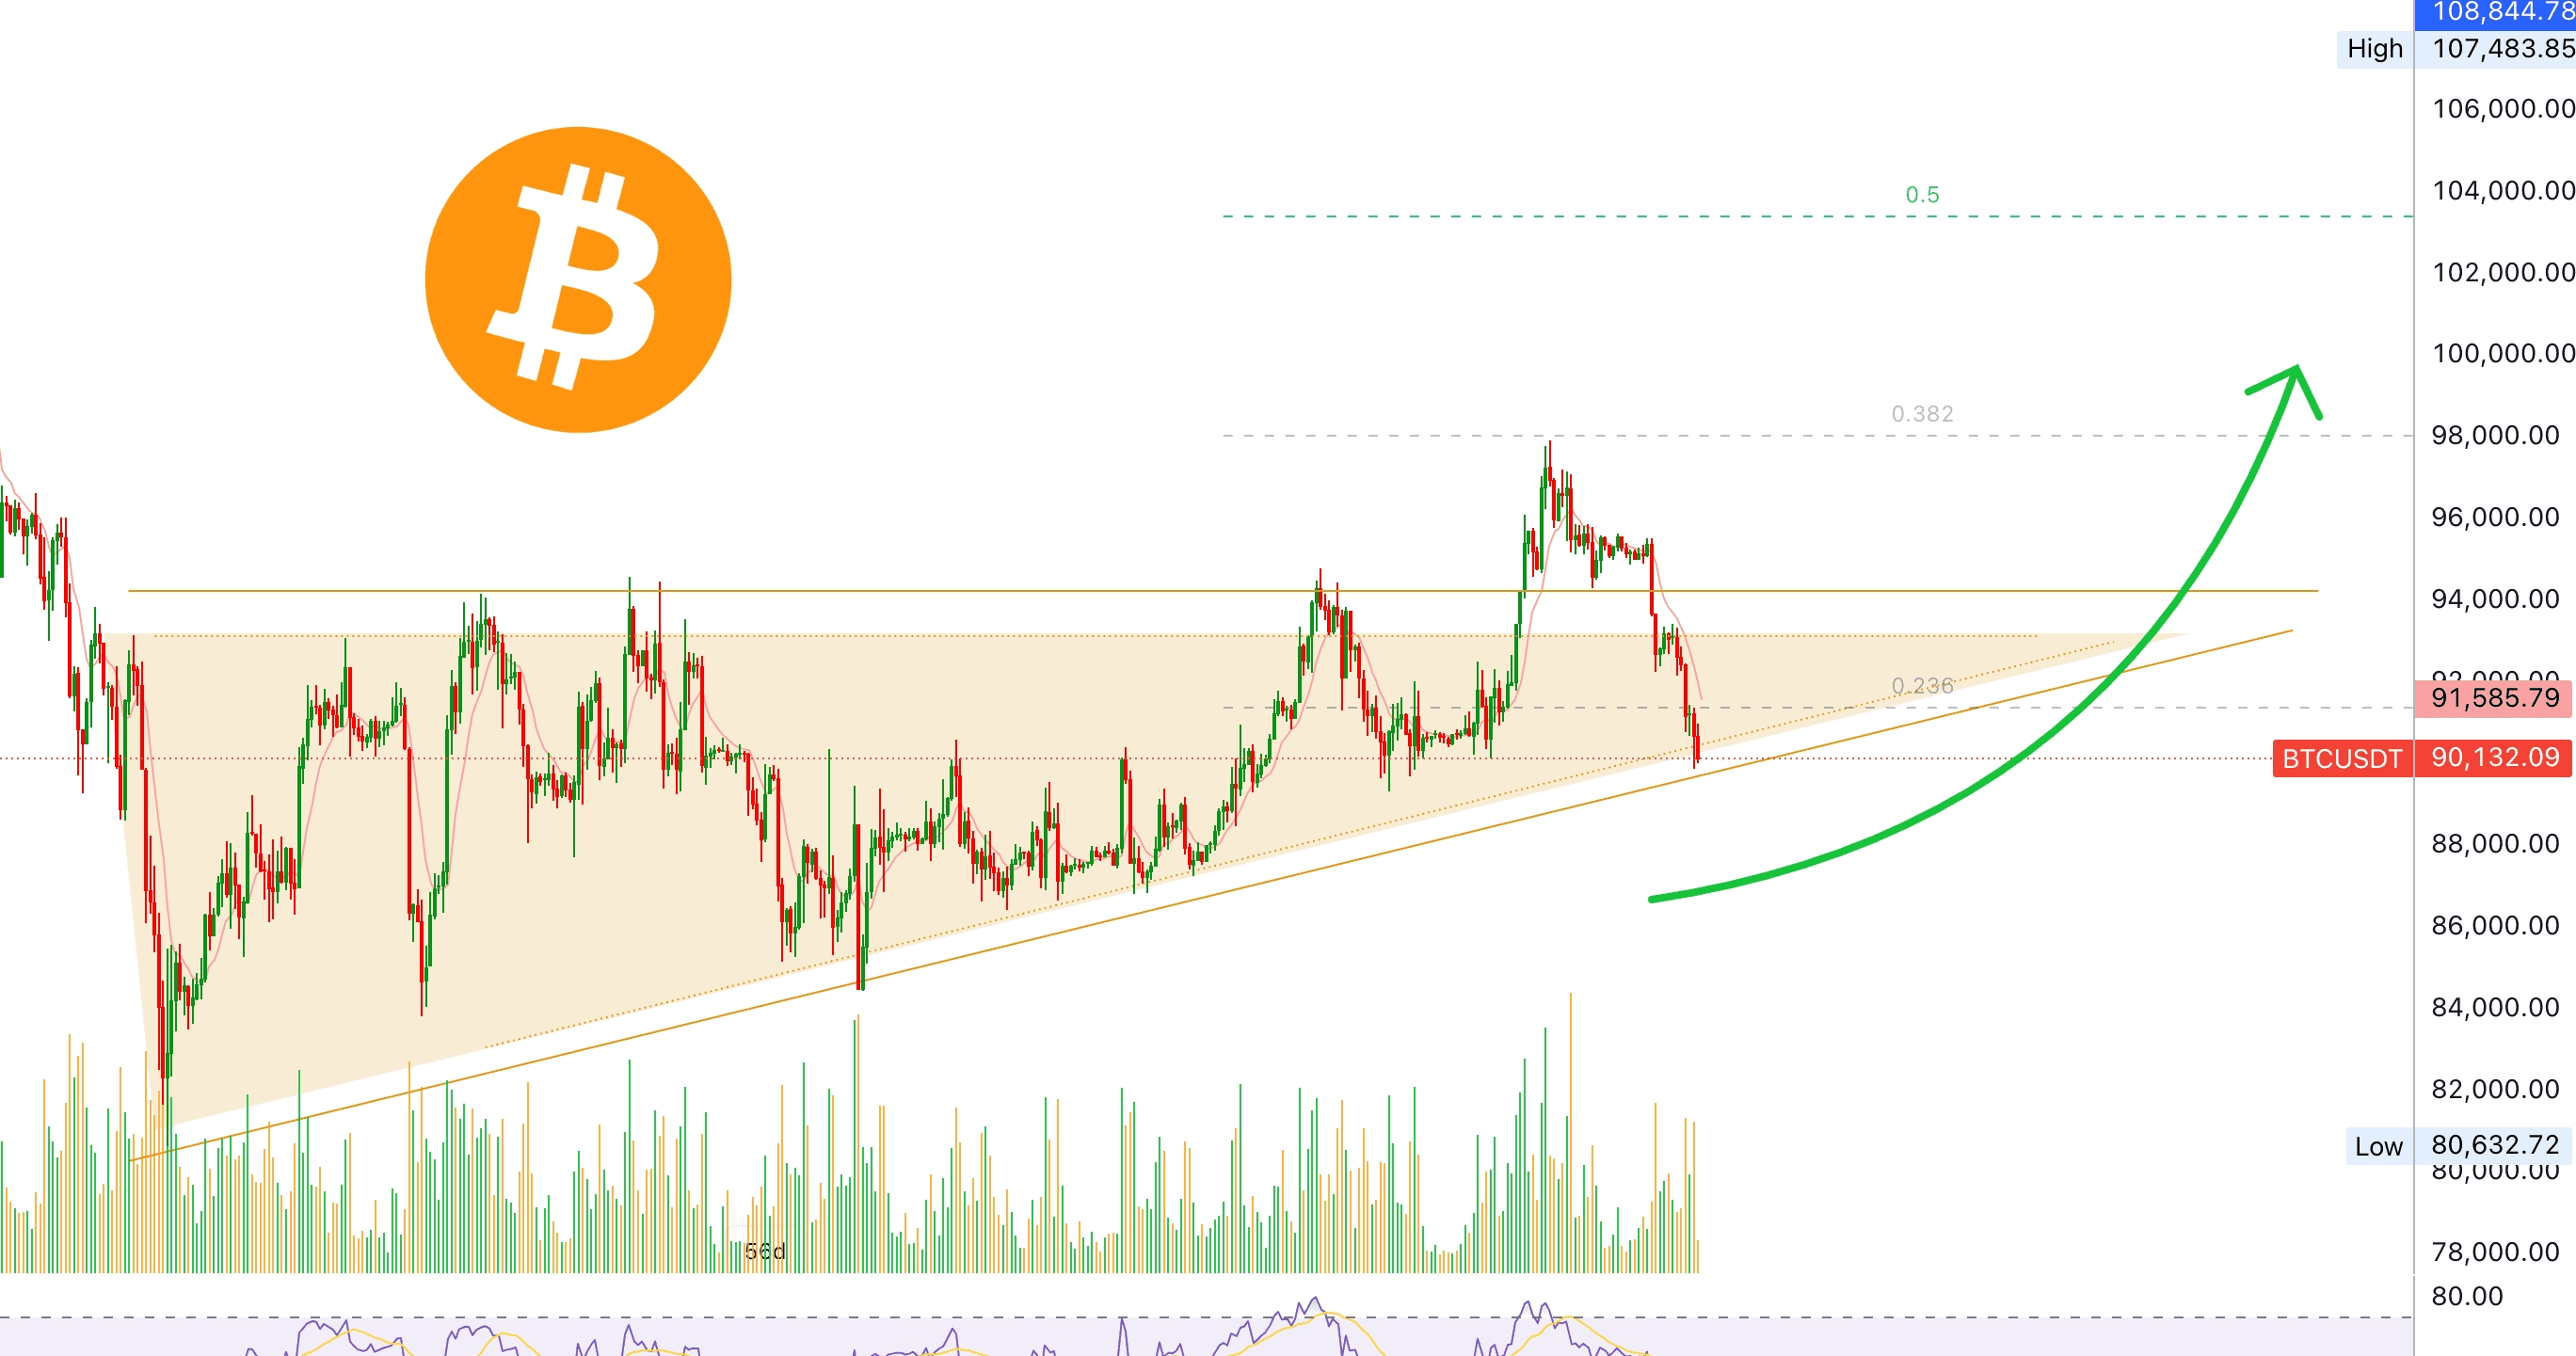
💰 Opportunity to buy below $90,000?
Bitcoin is still holding a strong higher-low structure.
In this context, if the price goes below $90K, it's not panic — rather an opportunity.
Smart money usually accumulates here.
📌 Big Picture
This dip is not the final story. It could be a relief rally or a pause before a new bullish leg.
For those who can manage risks with patience, this zone could be a game-changing entry.
🔚 Bottom Line
The market is scaring, but the data says otherwise.
RSI, volume, and historical patterns — all together, Bitcoin is standing in a bullish reversal zone.
Stay patient. Follow the strategy. Don't trade with emotion.