The recent market can be described as a 'roller coaster'. In the past few days, the geopolitical dispute over Greenland between the US and Europe, combined with risks related to Japanese government bonds, has caused global market risk appetite to plummet, with crypto assets being hit first, experiencing continuous downward pressure and a tense sentiment.

The turning point appeared last night. With Trump publicly stating that he would not impose taxes on Europe regarding the Greenland issue, market worries about an escalation of the trade war have clearly eased, allowing risk assets to breathe a sigh of relief for the first time in a while, and the crypto market has also stabilized.
Morning Overview: Geopolitical turning point brings rebound, but wounds remain
Yesterday's market can be regarded as a typical case of how macro events instantly reprice risk assets. The intraday structure exhibited extreme
'Bottom hunting → rebound → sharp drop → another rebound' fluctuation path.
It is worth noting that the correlation between the crypto market and U.S. stocks has significantly increased, with the Dow Jones, S&P, and NASDAQ all rising over 1.1%, and risk sentiment recovering simultaneously.
The root of the crash and the trigger for the rebound
Geopolitics: The source of risk and also the key to the rebound
The core trigger of this round of violent adjustment comes from Trump's previous remarks about imposing tariffs on Europe, which were quickly interpreted by the market as the 'Greenland crisis', triggering a rise in global risk aversion and a chain reaction of 'selling American assets'.
Dramatically, the same Trump released a signal of easing yesterday, stating that related issues have formed a 'framework for future agreements' and canceled the tariff threat originally scheduled to take effect on February 1. This statement directly ignited the rebound in the market.
But it is necessary to stay clear-headed:
This feels more like a **'braking before the cliff'**, rather than completely removing risk. The uncertainty of geopolitics remains unresolved.
MicroStrategy: An emotional 'double-edged sword'
Another factor repeatedly discussed in the market is the huge paper loss disclosed by MicroStrategy. Data shows that the company recorded an unrealized loss of about 17.44 billion USD in digital assets in the fourth quarter.
As the world's largest enterprise-level Bitcoin holder, its continuous and large-scale buying behavior has been interpreted by some traders as a 'signal of a temporary peak', which has suppressed market bullish sentiment to some extent.
IV. Current core judgment of the market: Rebound ≠ Reversal
Although the price has shown recovery, the overall market vitality has been hurt.
Bitcoin fluctuates repeatedly near 90,000 USD
Ethereum fluctuates around the psychological level of 3,000 USD
There is a significant divergence between bulls and bears, with capital sentiment leaning towards wait-and-see. This feels more like a technical rebound and emotional repair after a crash, rather than a formal confirmation of a trend reversal.
Bitcoin (BTC) trend analysis
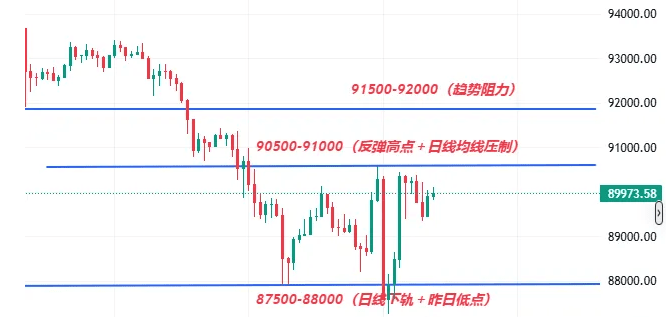
In terms of short-term technical structure, Bitcoin quickly rebounded after probing 87,209 USD, forming a clear V-shaped reversal, confirming that the support in the 87,000 – 87,200 USD range is effective.
Current price fluctuates around 90,000 USD, which has become the core area of short-term bullish and bearish competition.
Technical indicators:
Moving averages maintain a bullish arrangement
RSI rebounds, indicating a recovery of bullish momentum
Key resistance level:
90,500 – 90,600 USD
After a valid breakout, the upper target looks towards 92,000 – 93,000 USD
Key support level:
87,000 – 87,200 USD
Secondary support is at 88,000 – 88,500 USD
Ethereum (ETH) trend analysis
Ethereum's overall performance is relatively weak, and 3,000 USD is still the most important bullish-bearish dividing line.
Current price maintains fluctuations above the threshold
Bullish support exists, but upward momentum is insufficient
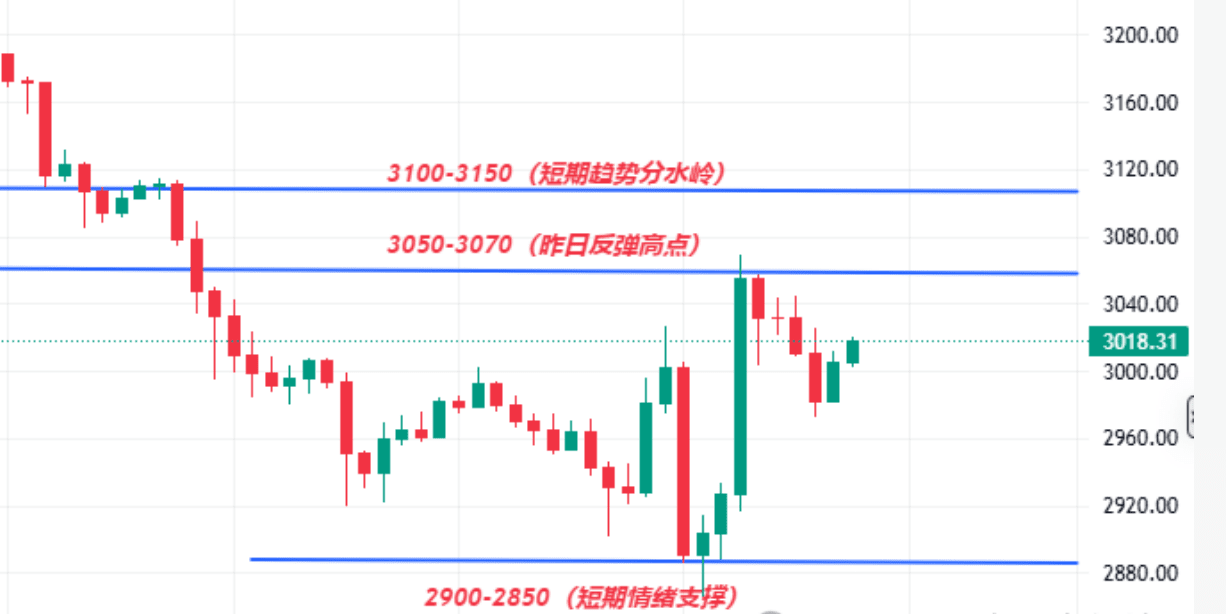
Resistance range:
3,000 – 3,050 USD
Short-term key resistance level is near 3,069 USD
Support range:
2,900 – 2,920 USD
If it breaks below, it may test the previous low of 2,867 USD
Indicator observation:
Hourly MACD momentum weakens
RSI maintains a neutral range
Short-term volatility may further expand
As long as the 2,900 USD support holds, there is still room for a rebound recovery; if it fails, then a deeper pullback needs to be guarded against.
Note: Geopolitical risks have temporarily cooled, allowing the market to catch its breath, but structural recovery still needs confirmation. Currently, it feels more like **'emotional bleeding stop', rather than 'trend reversal'**.