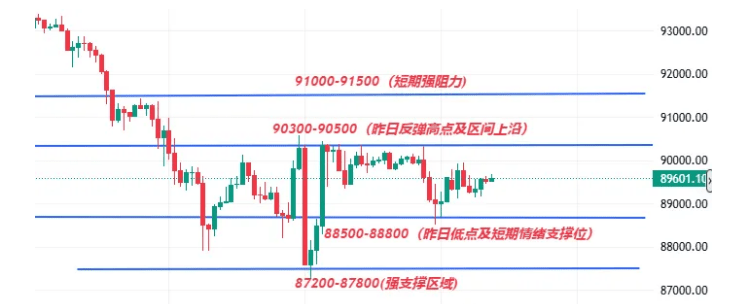
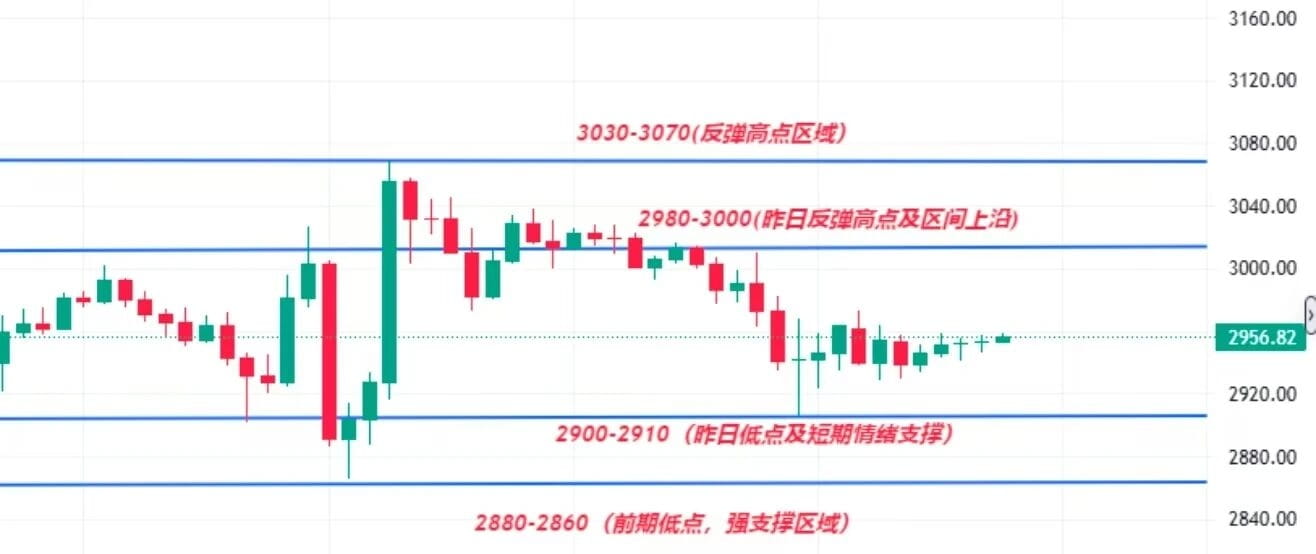
On January 23, Bitcoin and Ethereum's trends significantly diverged from the macro optimistic sentiment, showing a weak adjustment pattern. Bitcoin briefly rebounded to $90,335 in the evening but was subsequently hindered and fell back, hitting a low of $88,515, before entering a narrow consolidation around $89,500. It is currently trading at around $89,600. Ethereum performed even more weakly, with a rebound ending at $3,008, gradually falling to $2,907, and is now under pressure below $2,950.

This adjustment clearly reflects: As Trump lifted the tariff threat against Europe, the geopolitical tensions eased, and some short-term funds flowed out of the crypto market. Meanwhile, prices stagnated below the key technical resistance areas—Bitcoin $90,500-$91,000 and Ethereum $3,000-$3,050—indicating insufficient underlying buying momentum in the market, with the overall structure still in a weak state.
Capital flow shows divergence: Bitcoin ETF continues to maintain a net inflow of 189 million dollars, with BlackRock's IBIT increasing positions against the trend, providing support for prices; Ethereum ETF's short-term funding pressure has eased, and whales scooping up at lows also bring some support. Market sentiment has gradually returned to neutral from panic, but trading activity has shrunk.
Macroeconomic and regulatory environment: strong economy, high inflation, and cooling interest rate cut expectations.
On the macro level, the latest economic data has intensified market divergences regarding the Federal Reserve's policy path. The final value of the U.S. third quarter GDP annualized quarter rate has been revised up to 4.4%, while the core PCE price index year-on-year in November remains high at 2.9%. This 'strong economy + high inflation' combination weakens market expectations for rapid interest rate cuts, exerting interest rate pressure on risk assets.
On the regulatory front, the long-term trend is positive, but short-term uncertainties still exist. Key legislation like the (Clarity Act) progress will become an important catalyst for the subsequent market. The current market focus has gradually shifted from macro narratives to the industry’s own fundamentals and funding costs.
Looking ahead, the market needs to build effective support in the short term in the Bitcoin 88500-89000 dollars and Ethereum 2900-2860 dollars range. Healthy upward movement will require waiting for signals from the following aspects:
Signs of a shift in monetary policy have appeared;
Regulatory progress has made substantial advancements;
New narratives such as AI and asset tokenization have been validated.
Before this, the market may continue a high-volatility oscillation pattern.
Technical analysis: Key resistance under pressure, short-term trend is weak.
Bitcoin Trend Analysis
Daily level: The intraday high was 90335 dollars, and the low was 88515 dollars. Resistance near 90360 dollars (Fibonacci 0.786 position) is significant, coinciding with the rebound peak. MACD bearish momentum is still being released, and the price is between the lower band (87600 dollars) and the middle band (92300 dollars) of the Bollinger Bands, overall at a low level, with the possibility of a second bottom test.
Four-hour chart: There is a clear bottom divergence structure, but overall it is still a weak pattern. The 89800-90000 dollars range has turned into strong resistance, and the RSI has not effectively broken through the 50 midpoint, indicating insufficient momentum. If it attempts resistance again and falls back, key attention should be on the 87600-88000 dollars support area.
Ethereum Trend Analysis
Daily level: Yesterday's high was 3008 dollars, and the intraday low was 2907 dollars. 3120 dollars (combining EMA30 and Fibonacci 0.786) is a strong resistance above. MACD bears dominate, and the 2920 dollar support continues to be under pressure; if effectively broken, it may further decline.
Four-hour chart: After failing to reach 3070 dollars, it has continued to decline, with an overall bearish trend. 2920 dollars is a core area of concentrated chips. Key support below focuses on 2900-2920 dollars, with resistance looking toward the 3000 dollar round number and 3120 dollars. The KDJ indicator is about to form a death cross, and short-term downward risk still exists.
Note: Don't rush to place bets; the market is still 'self-validating direction.'
Considering the current macro environment, capital structure, and technical forms, this round of rebound seems more like an emotional repair after the easing of negative factors rather than the starting point of a trend reversal. The risk of tariffs has temporarily receded, but that does not mean uncertainty has disappeared; under the backdrop of strong economy and high inflation, monetary policy's suppression of risk assets has not been lifted.
For traders, the most important thing right now is not to judge whether 'it will take off,' but to confirm whether key support can be repeatedly validated and held firm. Before BTC effectively recovers 90,500–91,000 and ETH re-establishes itself above 3,050, any overly optimistic qualitative outlook carries the risk of being counter-validated by the market.
Therefore, strategically it is more appropriate to lower expectations and slow down the pace:
In the range, respond to fluctuations with a defensive mindset, waiting for a clear structure and funds to provide a clear direction before making choices. A true market trend never starts when emotions are loudest, but quietly unfolds after most people hesitate and the market has exhausted its patience.