
This article is based on real-time data from the Binance platform, combined with core technical indicators such as MACD, RSI, and moving averages, to conduct an in-depth analysis of $ETH short-term trends. The article is solely a personal technical analysis opinion and does not constitute any investment advice.
1. Macroeconomic Background: Long and short battles in a fluctuating market
Today (January 24, 2026), the cryptocurrency market continues to fluctuate at high levels. $BTC Testing the $89,000 range, ETH is currently reported at $2,960.03, down 0.44% for the day, with a 24-hour volatility of 4.39%. Prices are fluctuating widely between $2,892 and $3,019, reflecting intense long and short battles around the psychological level of $3,000. The 24-hour trading volume is $21.86 billion, with ample liquidity, as institutional funds frequently enter and exit between $2,940 and $2,970.
II. In-depth Interpretation of Technical Indicators: Resonance and Divergence of Three Major Signals
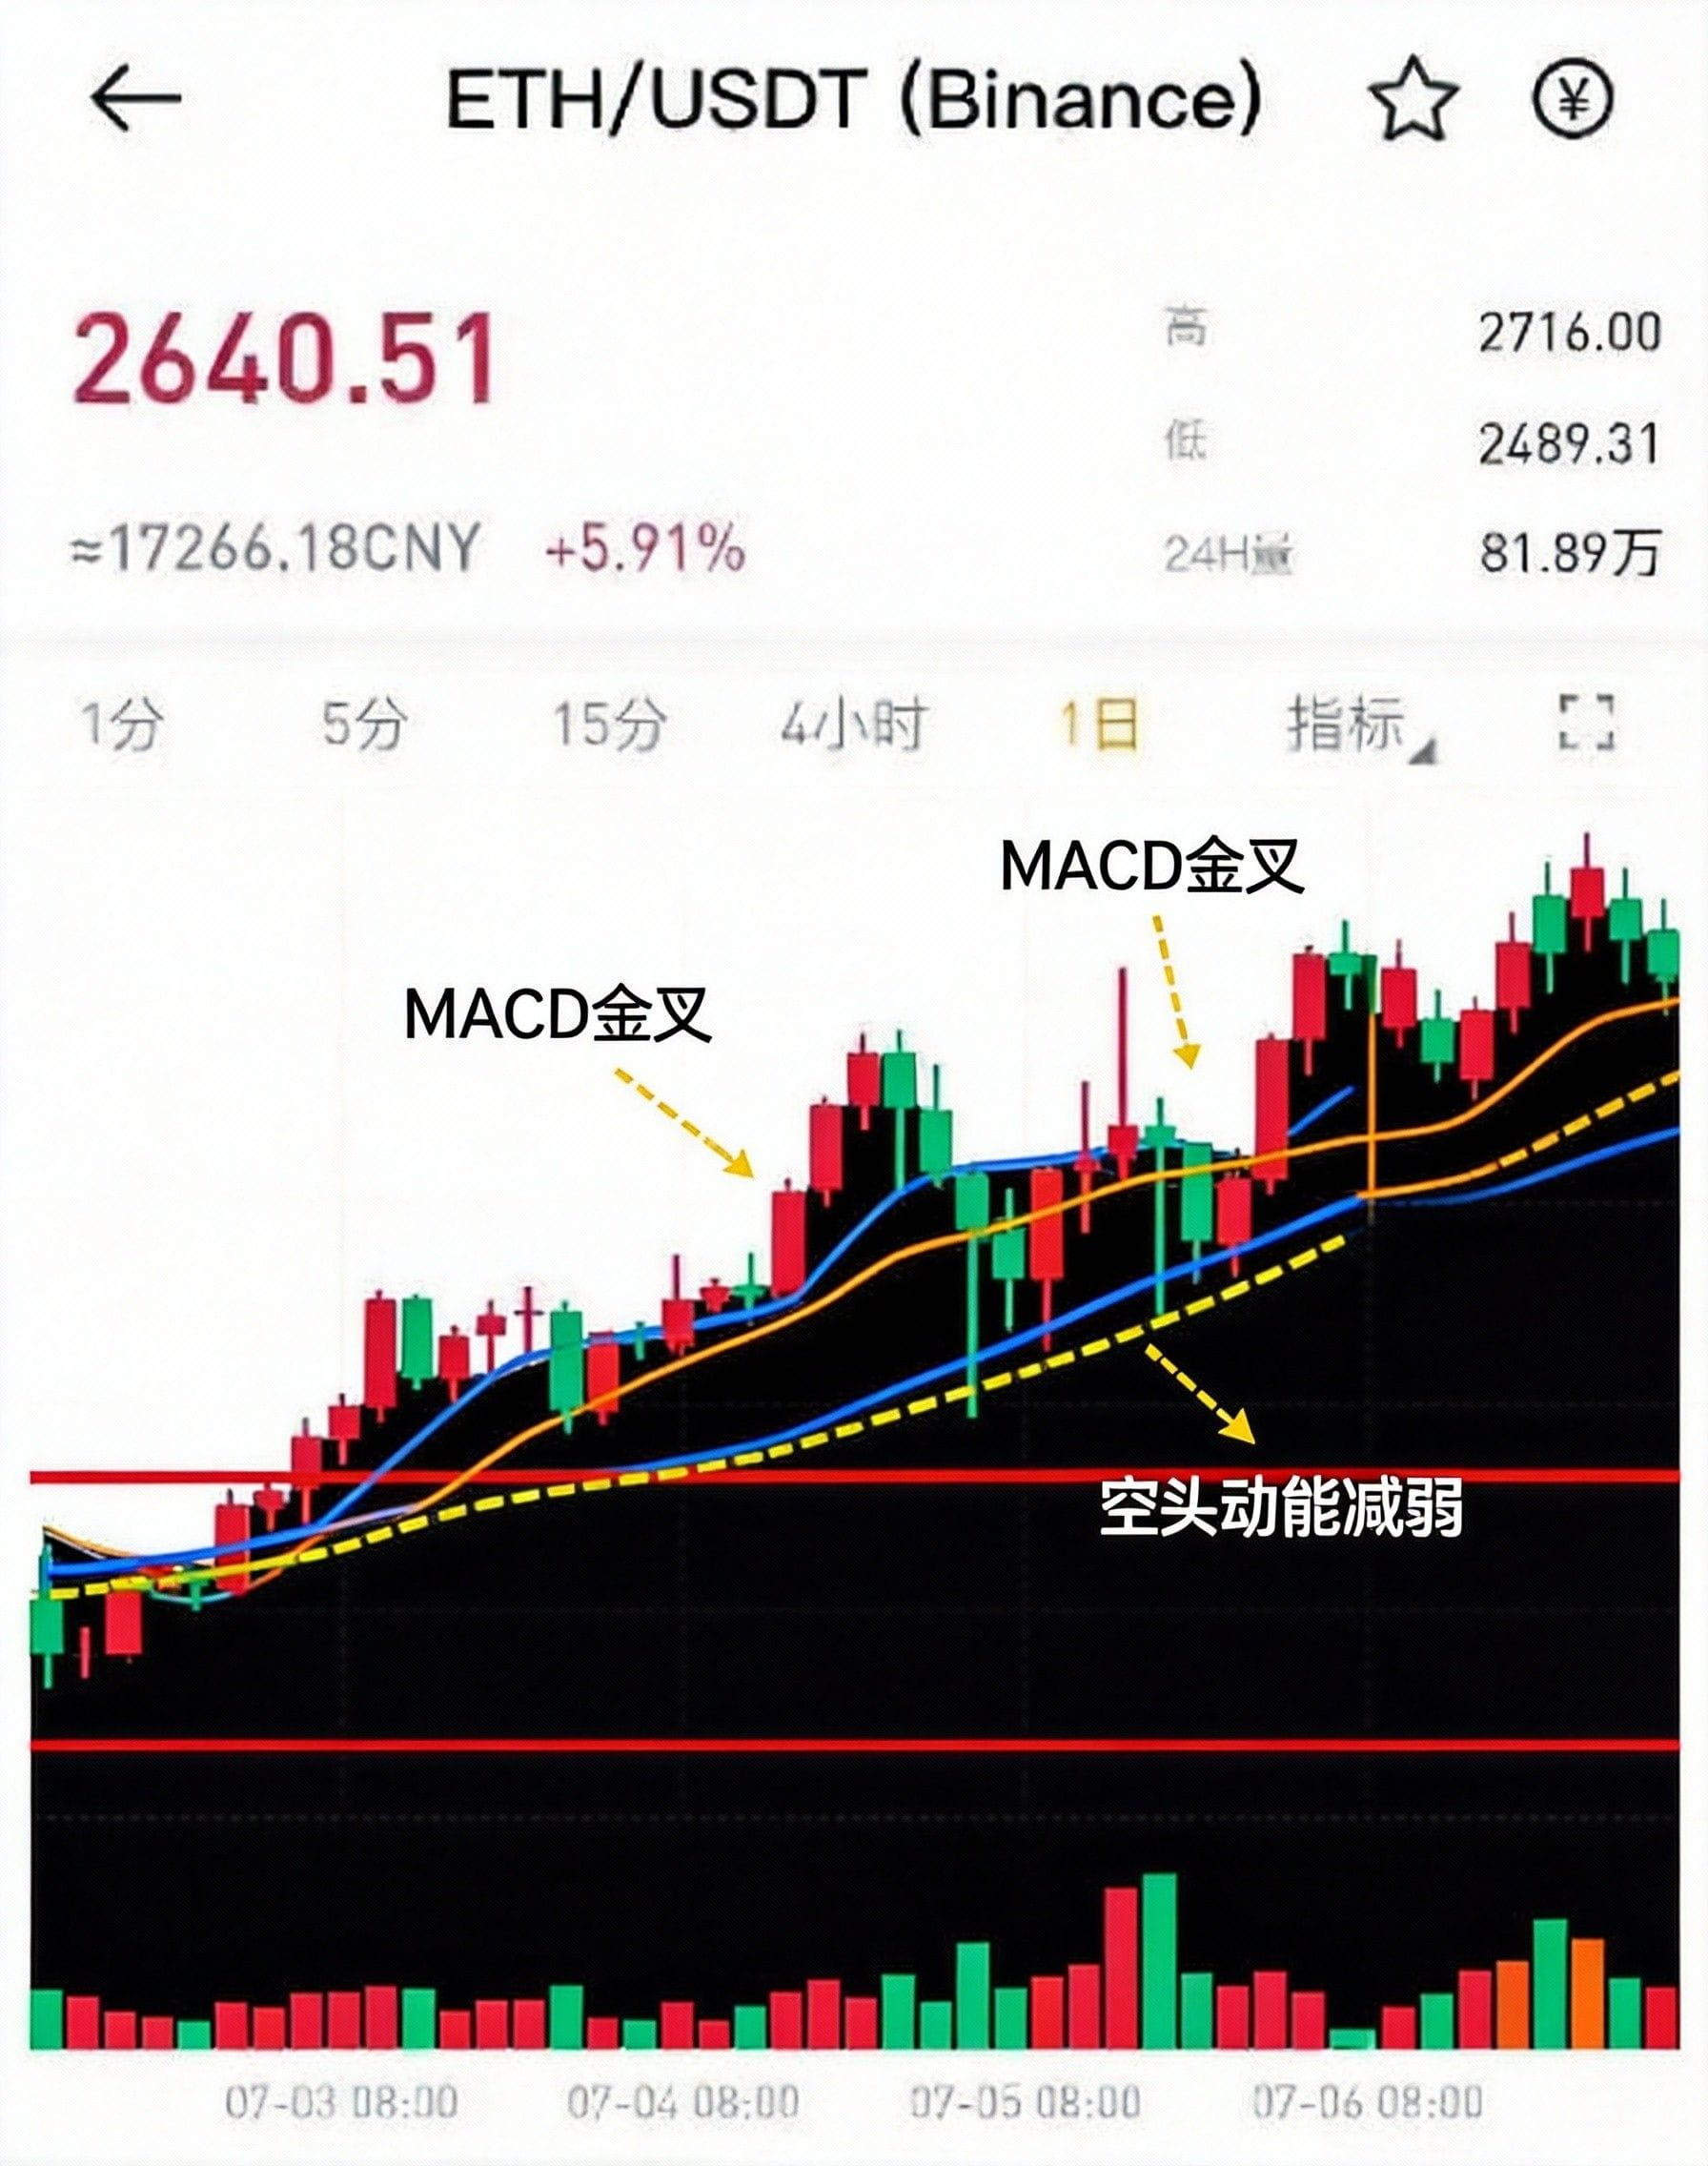
1. MACD Indicator: Bearish Momentum Weakening
MACD on the 5-minute chart shows bearish momentum weakening signal: DIF -1.42, DEA -1.15, MACD bar -0.55. Key observation points:
Bar Chart Contraction: Red bar reduced from -2.15 to -0.55, bearish momentum weakened
Bottom Divergence Prototype: Price makes a new low but MACD low points rise, forming a bottom divergence
Golden Cross Expectation: DIF and DEA distance narrowed to 0.27, a golden cross may occur in the short term
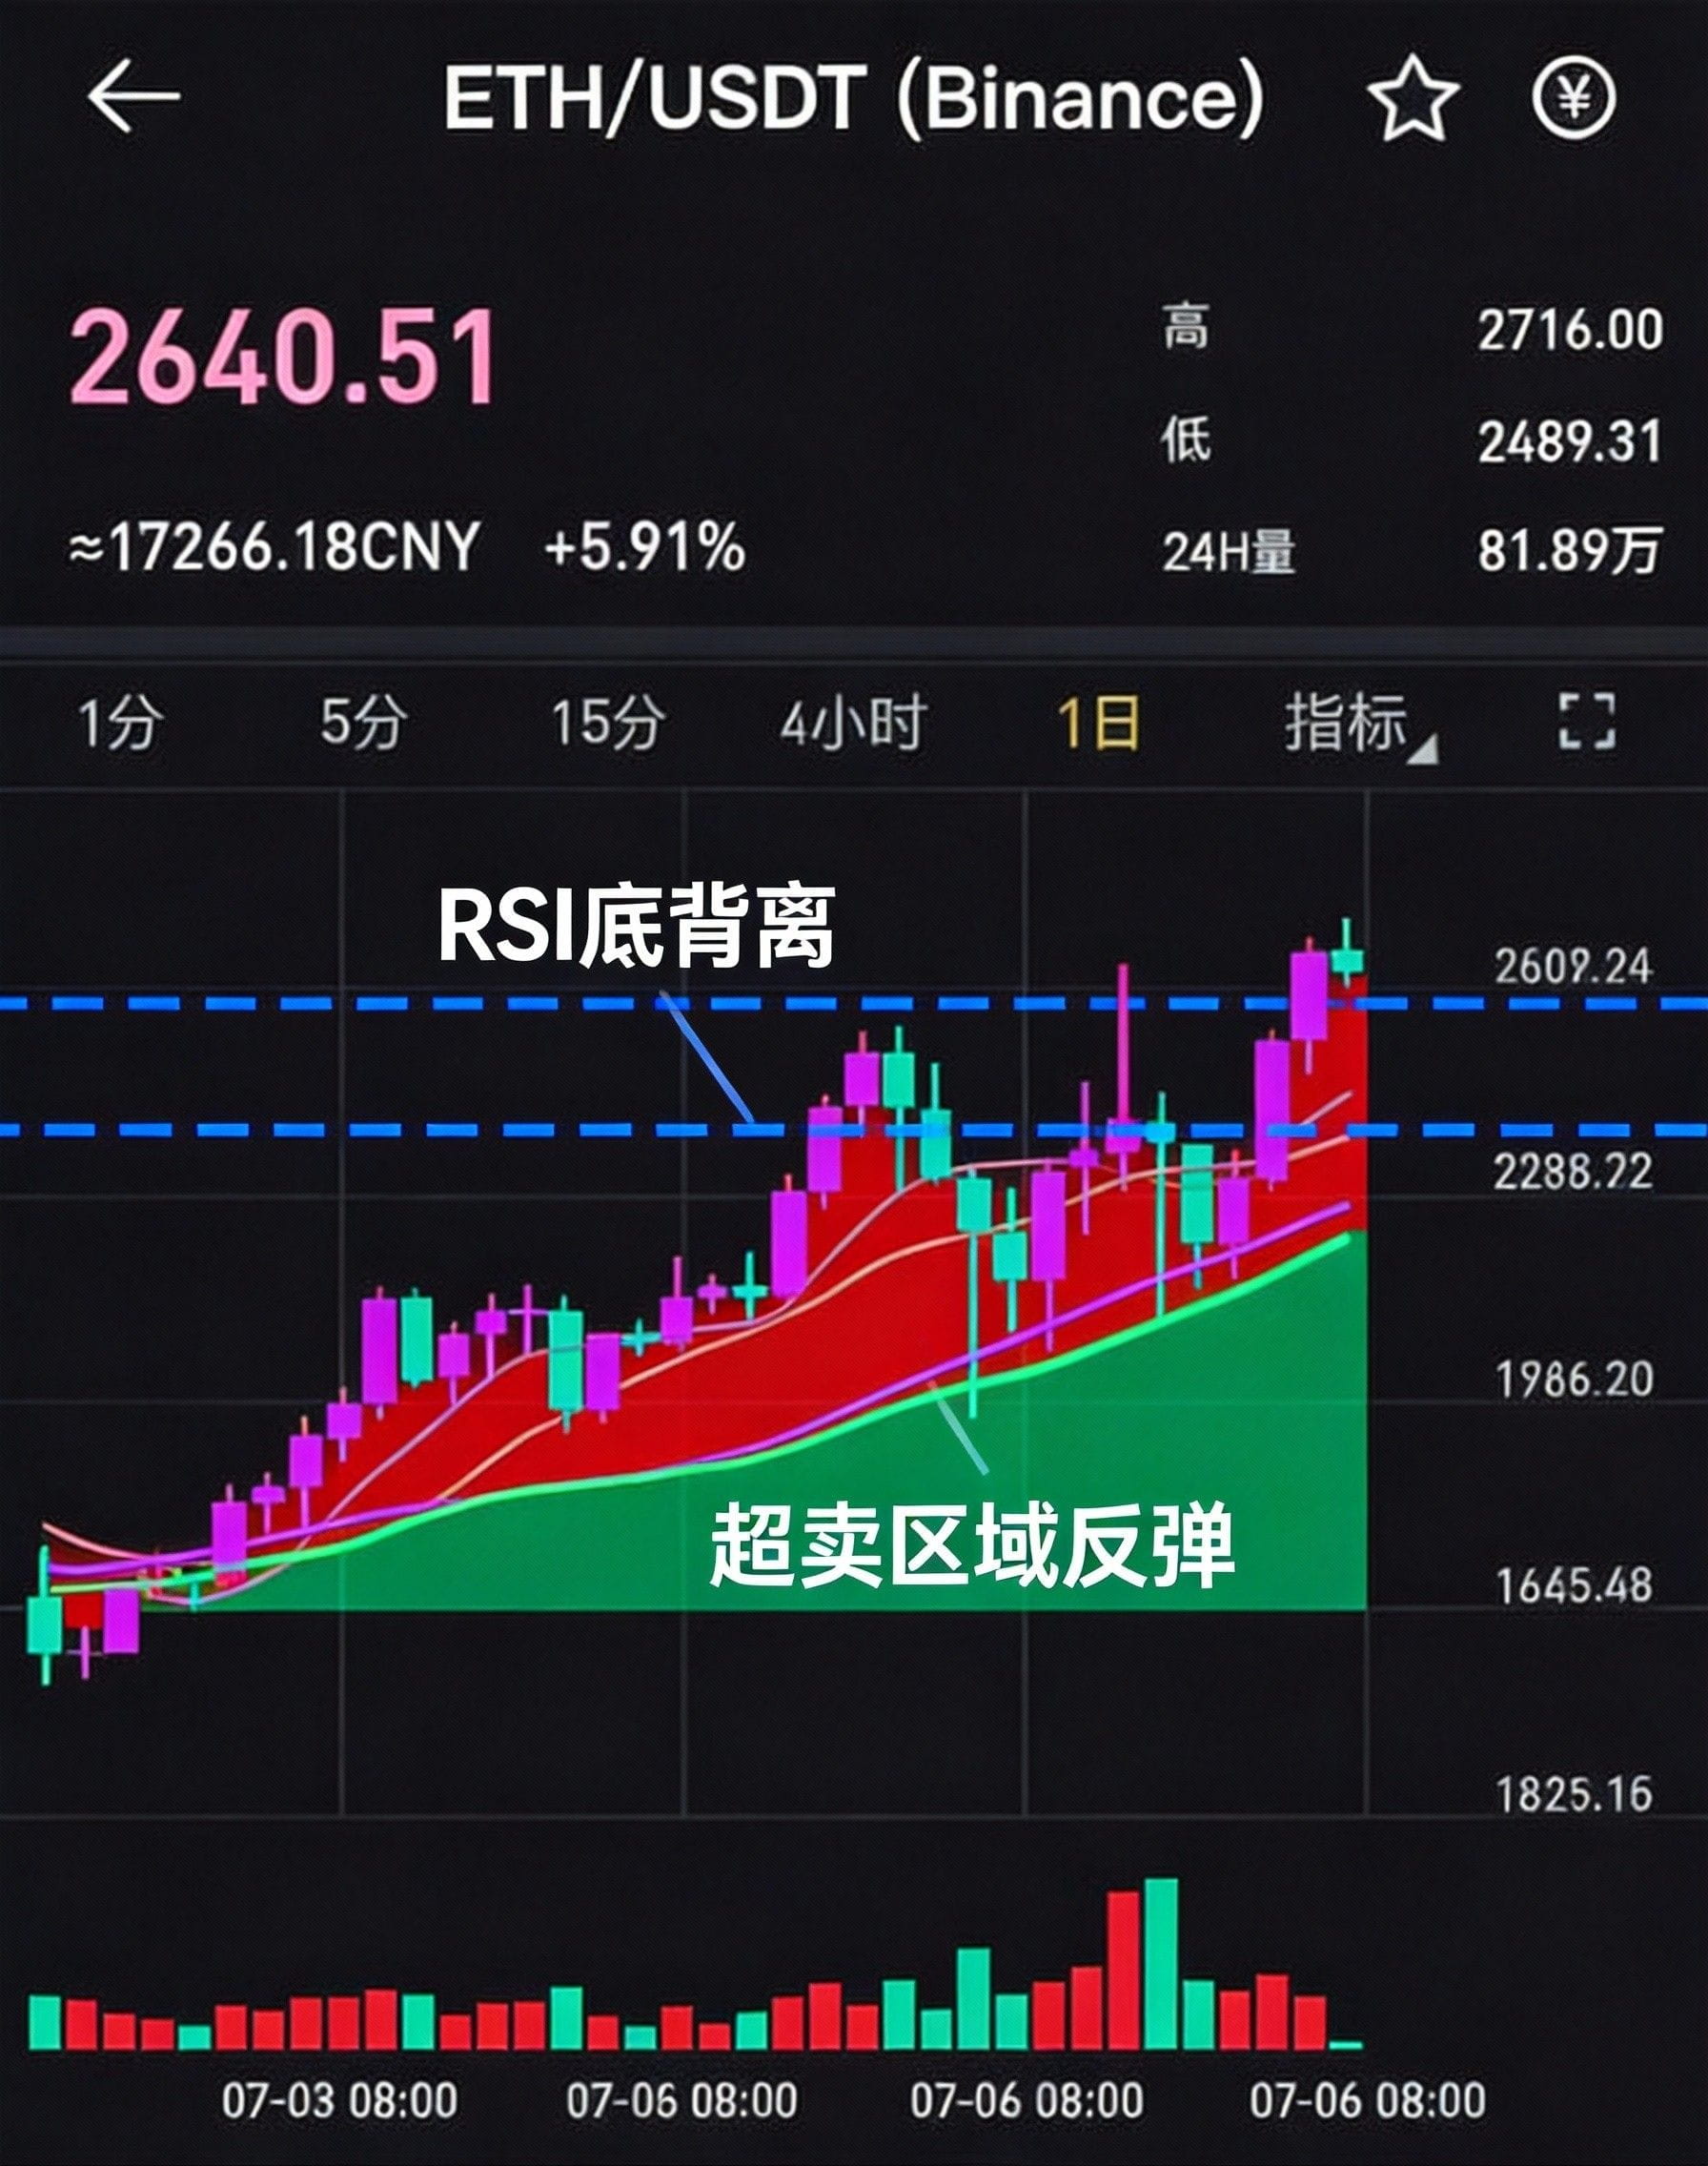
2. RSI Indicator: Rebound from Oversold Area
14-day RSI currently at 43.17, neutral to weak. 5-minute level characteristics:
Oversold Rebound: RSI once dipped below 30 and then quickly rebounded, showing buying support below $2,900
Bottom Divergence Confirmation: RSI low points rise when price makes a new low, standard bottom divergence signal
Long-Short Boundary: 45 is the key watershed, currently still below, bearish dominance
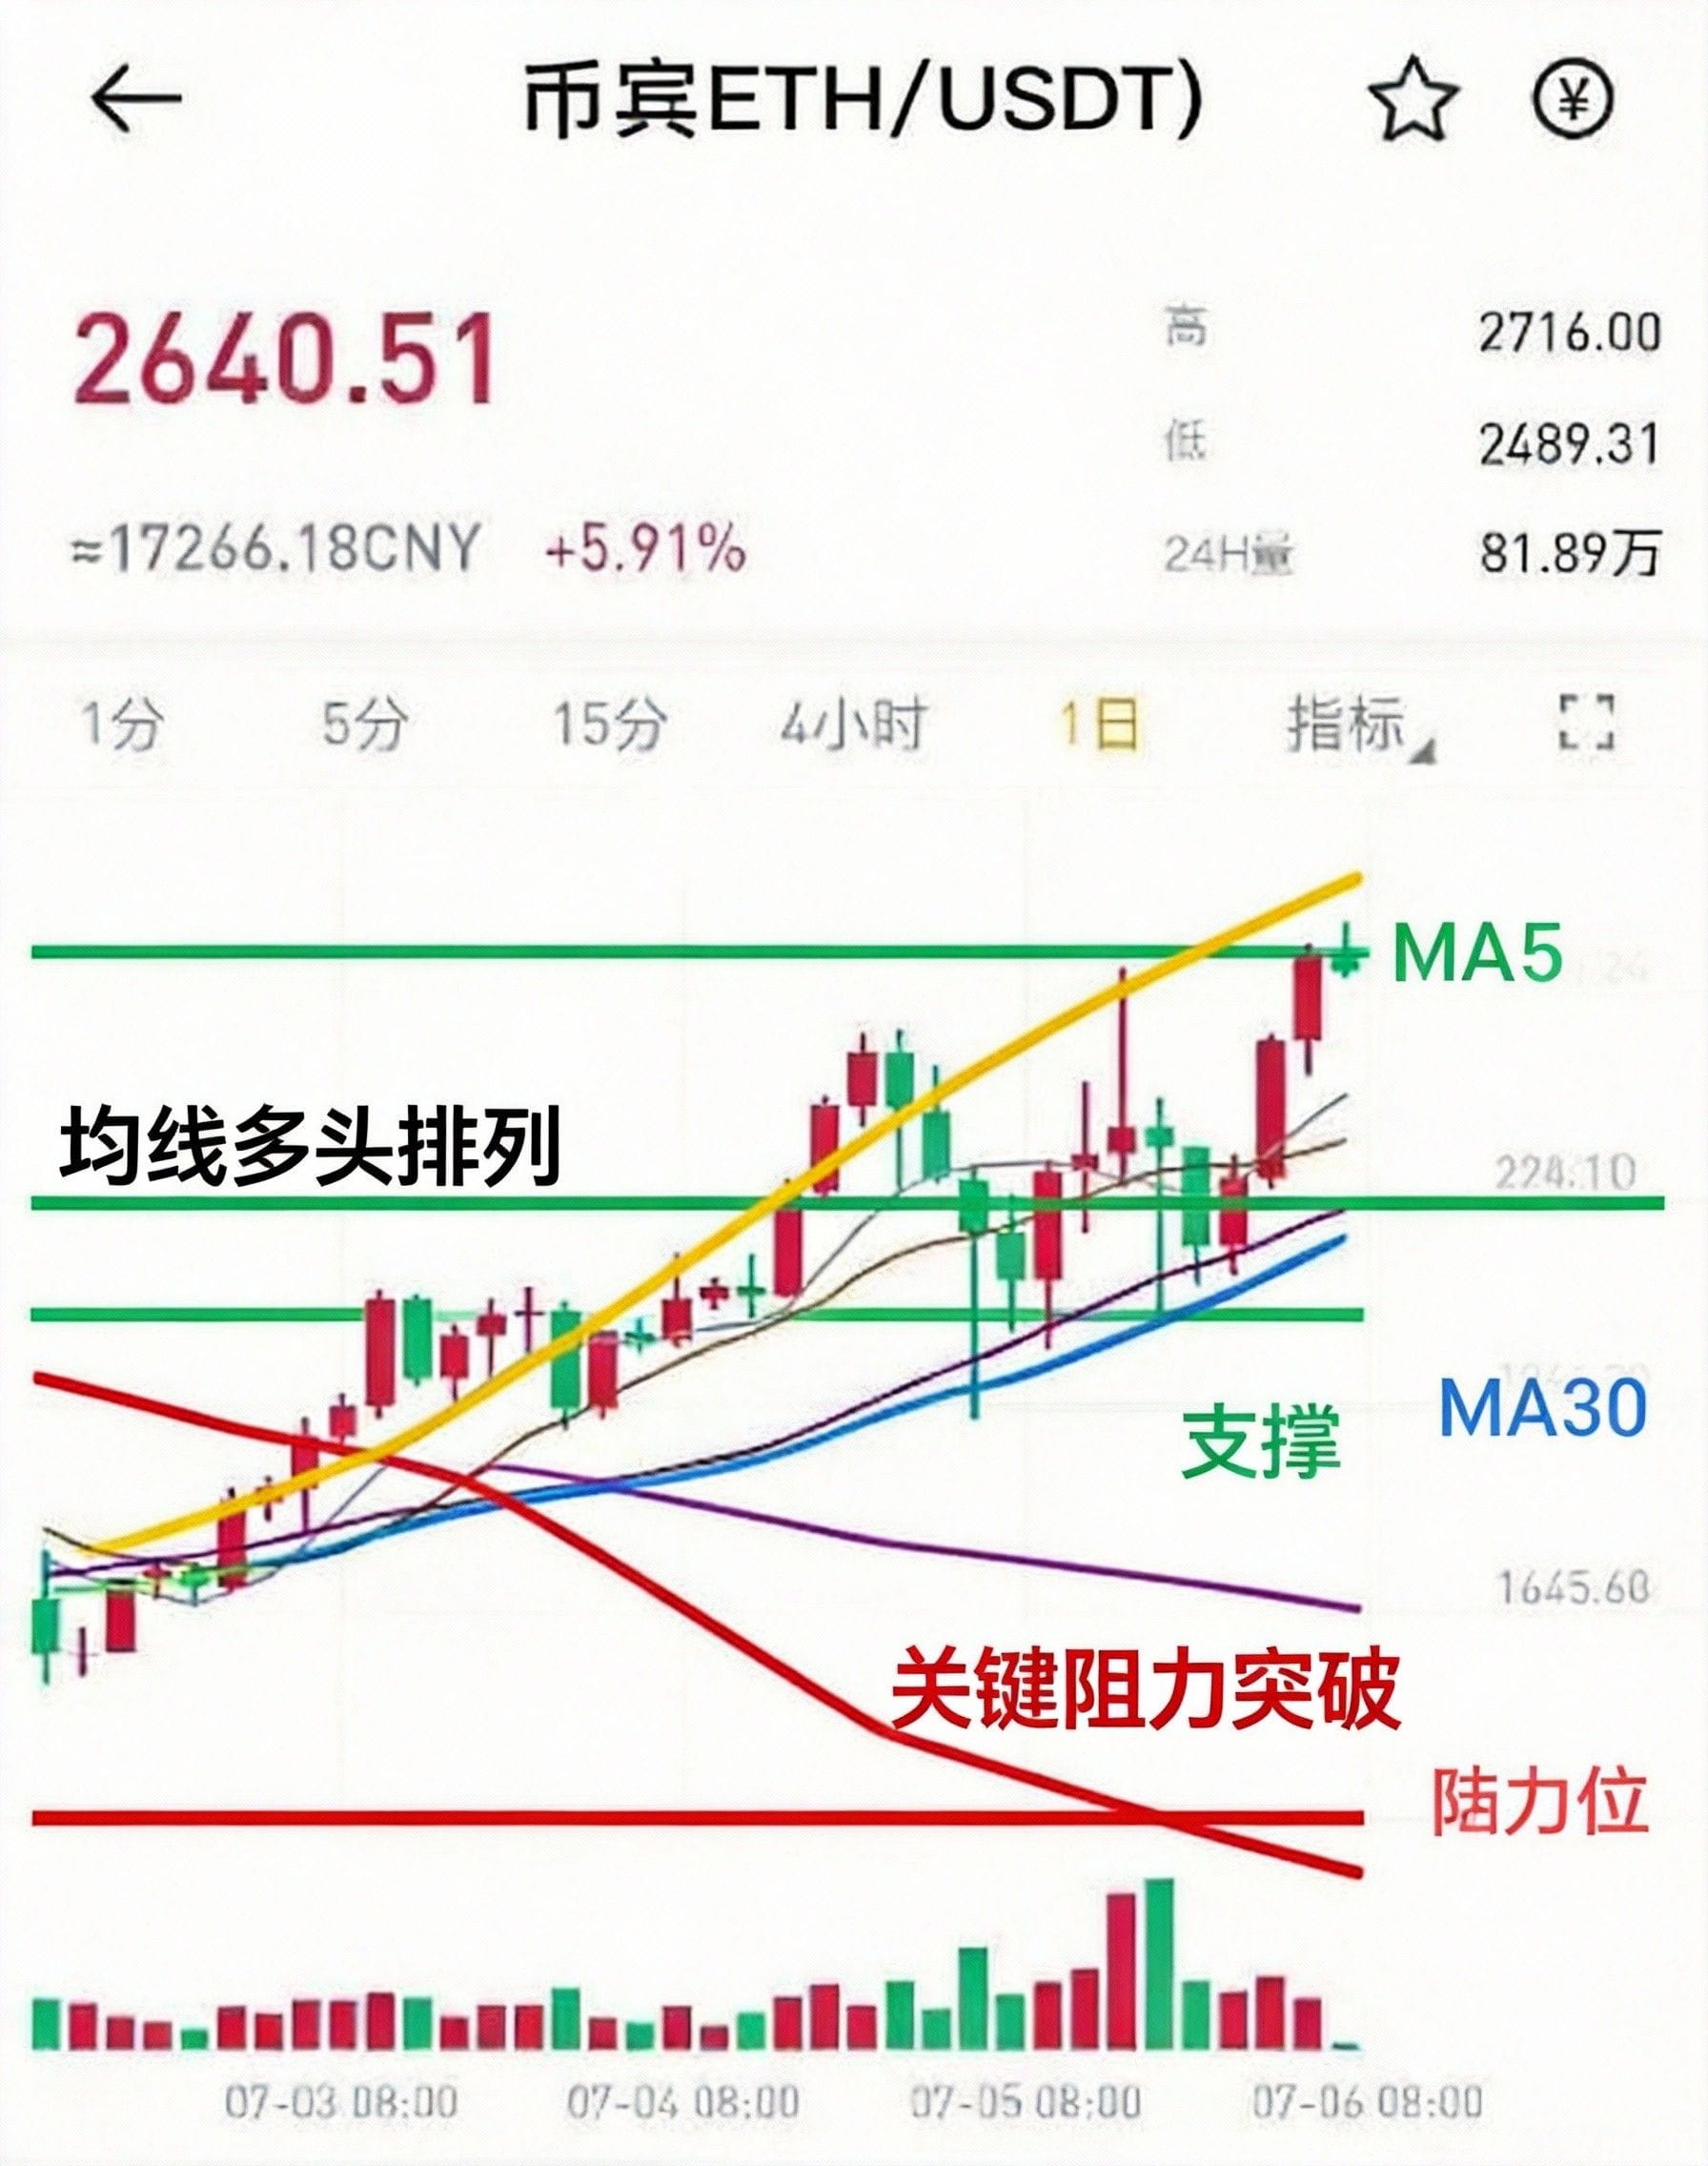
3. Moving Average System: Bearish Arrangement Suppression
The moving average system shows a clear bearish arrangement, suppressing price upward:
MA5 $3,007 (short-term resistance)
MA10 $3,157 (mid-term pressure)
MA20 $3,150 (trend pressure)
Price must continuously break through MA5 and MA10 to reverse weakness
III. Multi-Time Frame Analysis: Market Structure Insight
5-minute Level: Range Volatility
Prices fluctuate within the $2,900-$3,020 box, currently near the midpoint at $2,960. The upper boundary $3,020 is the key breakout level, while the lower boundary $2,900 is important support.
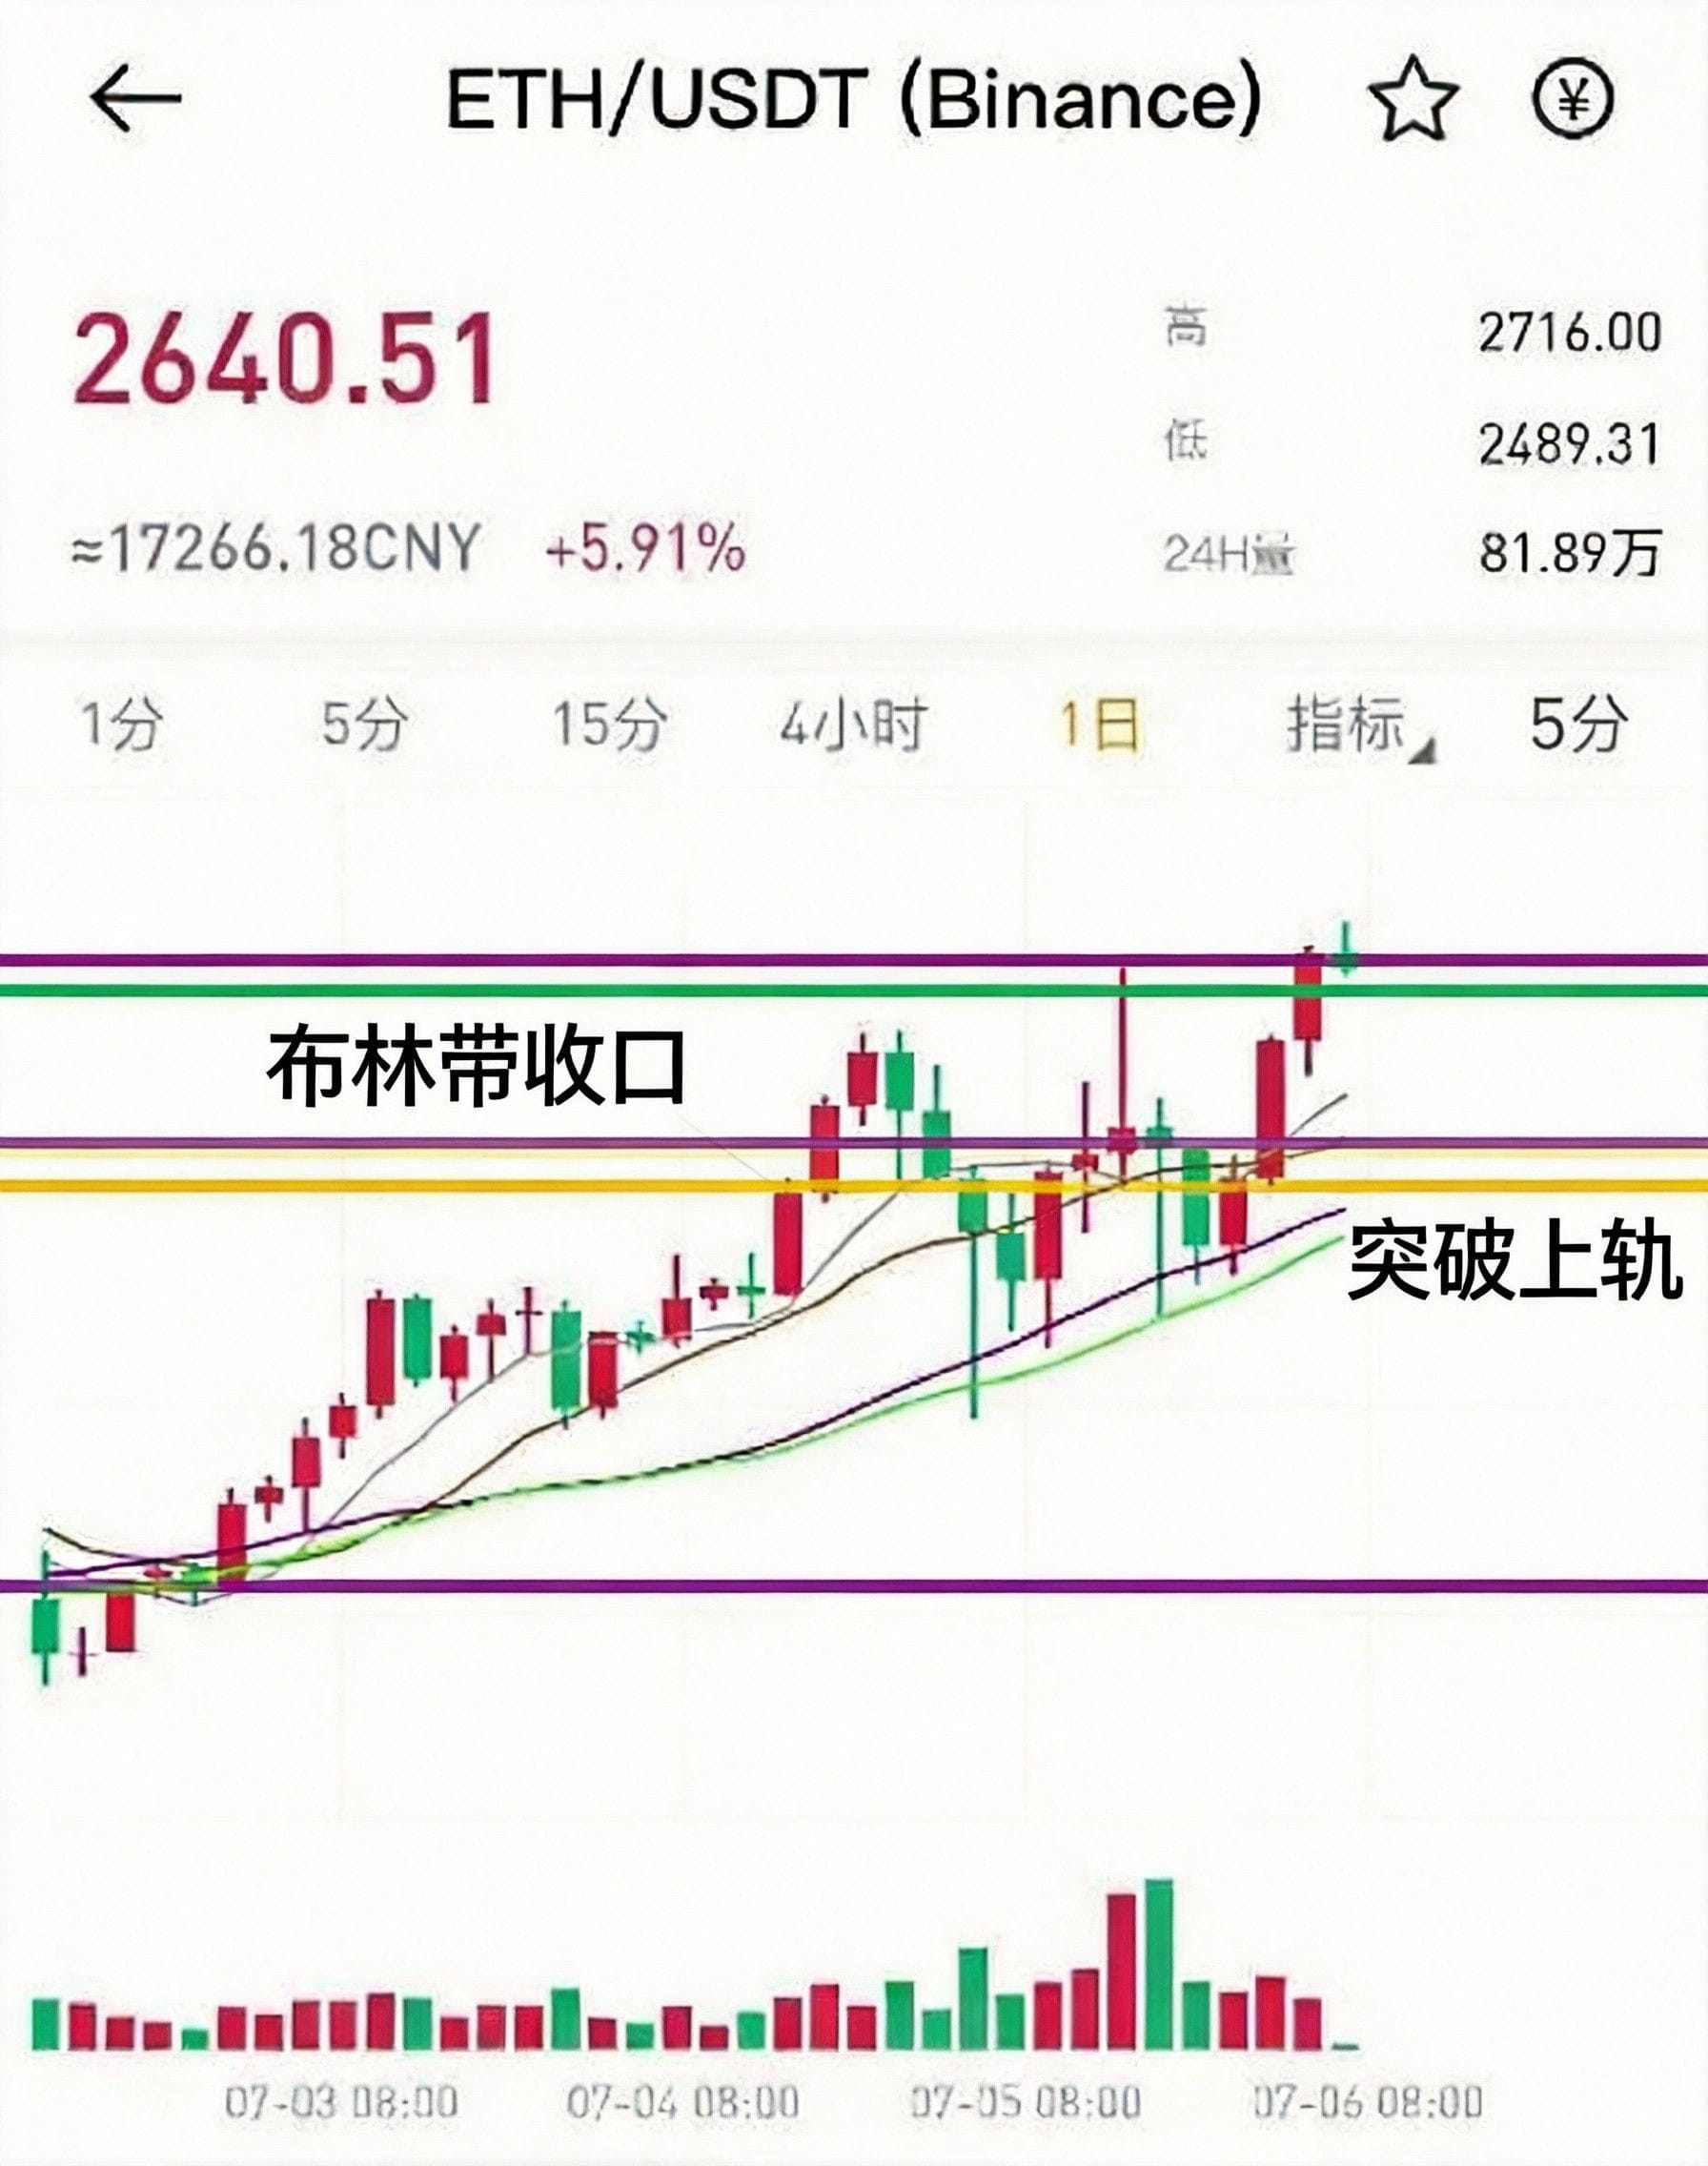
1-hour Level: Trend Reversal Signal
Downward trend continues but slope slows, KDJ forms a golden cross, and Bollinger Bands contract indicating a directional choice.
Daily Level: Healthy Correction
The long-term upward trend is intact, currently near the 38.2% Fibonacci retracement level at support around $2,950, and MACD remains above the zero axis.
IV. Operation Strategy and Risk Management
Short-term Strategy (1-3 days)
Bullish Entry: Price stabilizes above $2,970 and breaks MA5, target $3,020-$3,080, stop loss $2,920
Bearish Entry: Breaks below $2,940 with weak rebound, target $2,900-$2,850, stop loss $2,970
Position Control: Single trade risk does not exceed 2% of total capital, total position intraday does not exceed 10%
Medium-term Strategy (1-2 weeks)
Wait for directional confirmation, breaking through $3,020 can build long positions in batches
Holding spot can consider hedging with put options above $3,100
Key Price Level
Table
Type Price Importance Remarks Resistance $3,020 High upper box boundary, break strong Resistance $3,080 Medium MA10 pressure Resistance $3,150 High previous high pressure zone Support $2,940 Medium intraday long-short boundary Support $2,900 High lower box boundary Key Support $2,850 Extremely high rising trend line life and death line
Core Risk Management
Strictly execute preset stop-loss to avoid emotional holding
Ensure a profit-loss ratio of at least 1.5:1
Single variety risk exposure does not exceed 5% of total capital
Reduce trading frequency in a volatile market, waiting for high-probability opportunities
Conclusion
$ETH Currently in a key technical choice period. MACD bottom divergence, RSI oversold rebound, and moving average bearish arrangement form a complex signal combination. Short-term traders can capitalize on range features for high sell-low buy, while medium to long-term investors should wait for clear direction before positioning. Remember: the market is always right, when analysis contradicts the trend, first examine your own framework.
Follow Xiao Hai to discuss the cryptocurrency circle for more in-depth technical analysis