Hello friends, I am Xiao Hai. Today the market is truly a 'Black Monday'—Bitcoin fell by 3.3%, Ethereum fell by over 5%, and over 200,000 investors have been liquidated across the network. In this kind of market, we need to stay calm and see which coins have real resilience.
Today we analyze $SEI (Sei Network). Market cap ranking #120, price $0.11, niche but on-chain data is exceptionally active: daily active addresses exceed 1.5 million (a historical high), and the gaming sector has 11 games with over 300,000 monthly active addresses. Prices are falling, but users are flooding in; this kind of 'data divergence' is worth digging deeper.
Macroeconomic background: global decline, why can $SEI 'stand out on its own'?
North American trade tensions, dollar index plummeting, geopolitical risks—macro factors have pushed the cryptocurrency market off a cliff. However, the data of the $SEI network has grown against the trend: TVL remains stable at $471 million (peak $550 million), transaction fees are below $0.001 (much cheaper than Ethereum). Low cost and good experience, users are willing to continue using it in the bear market.
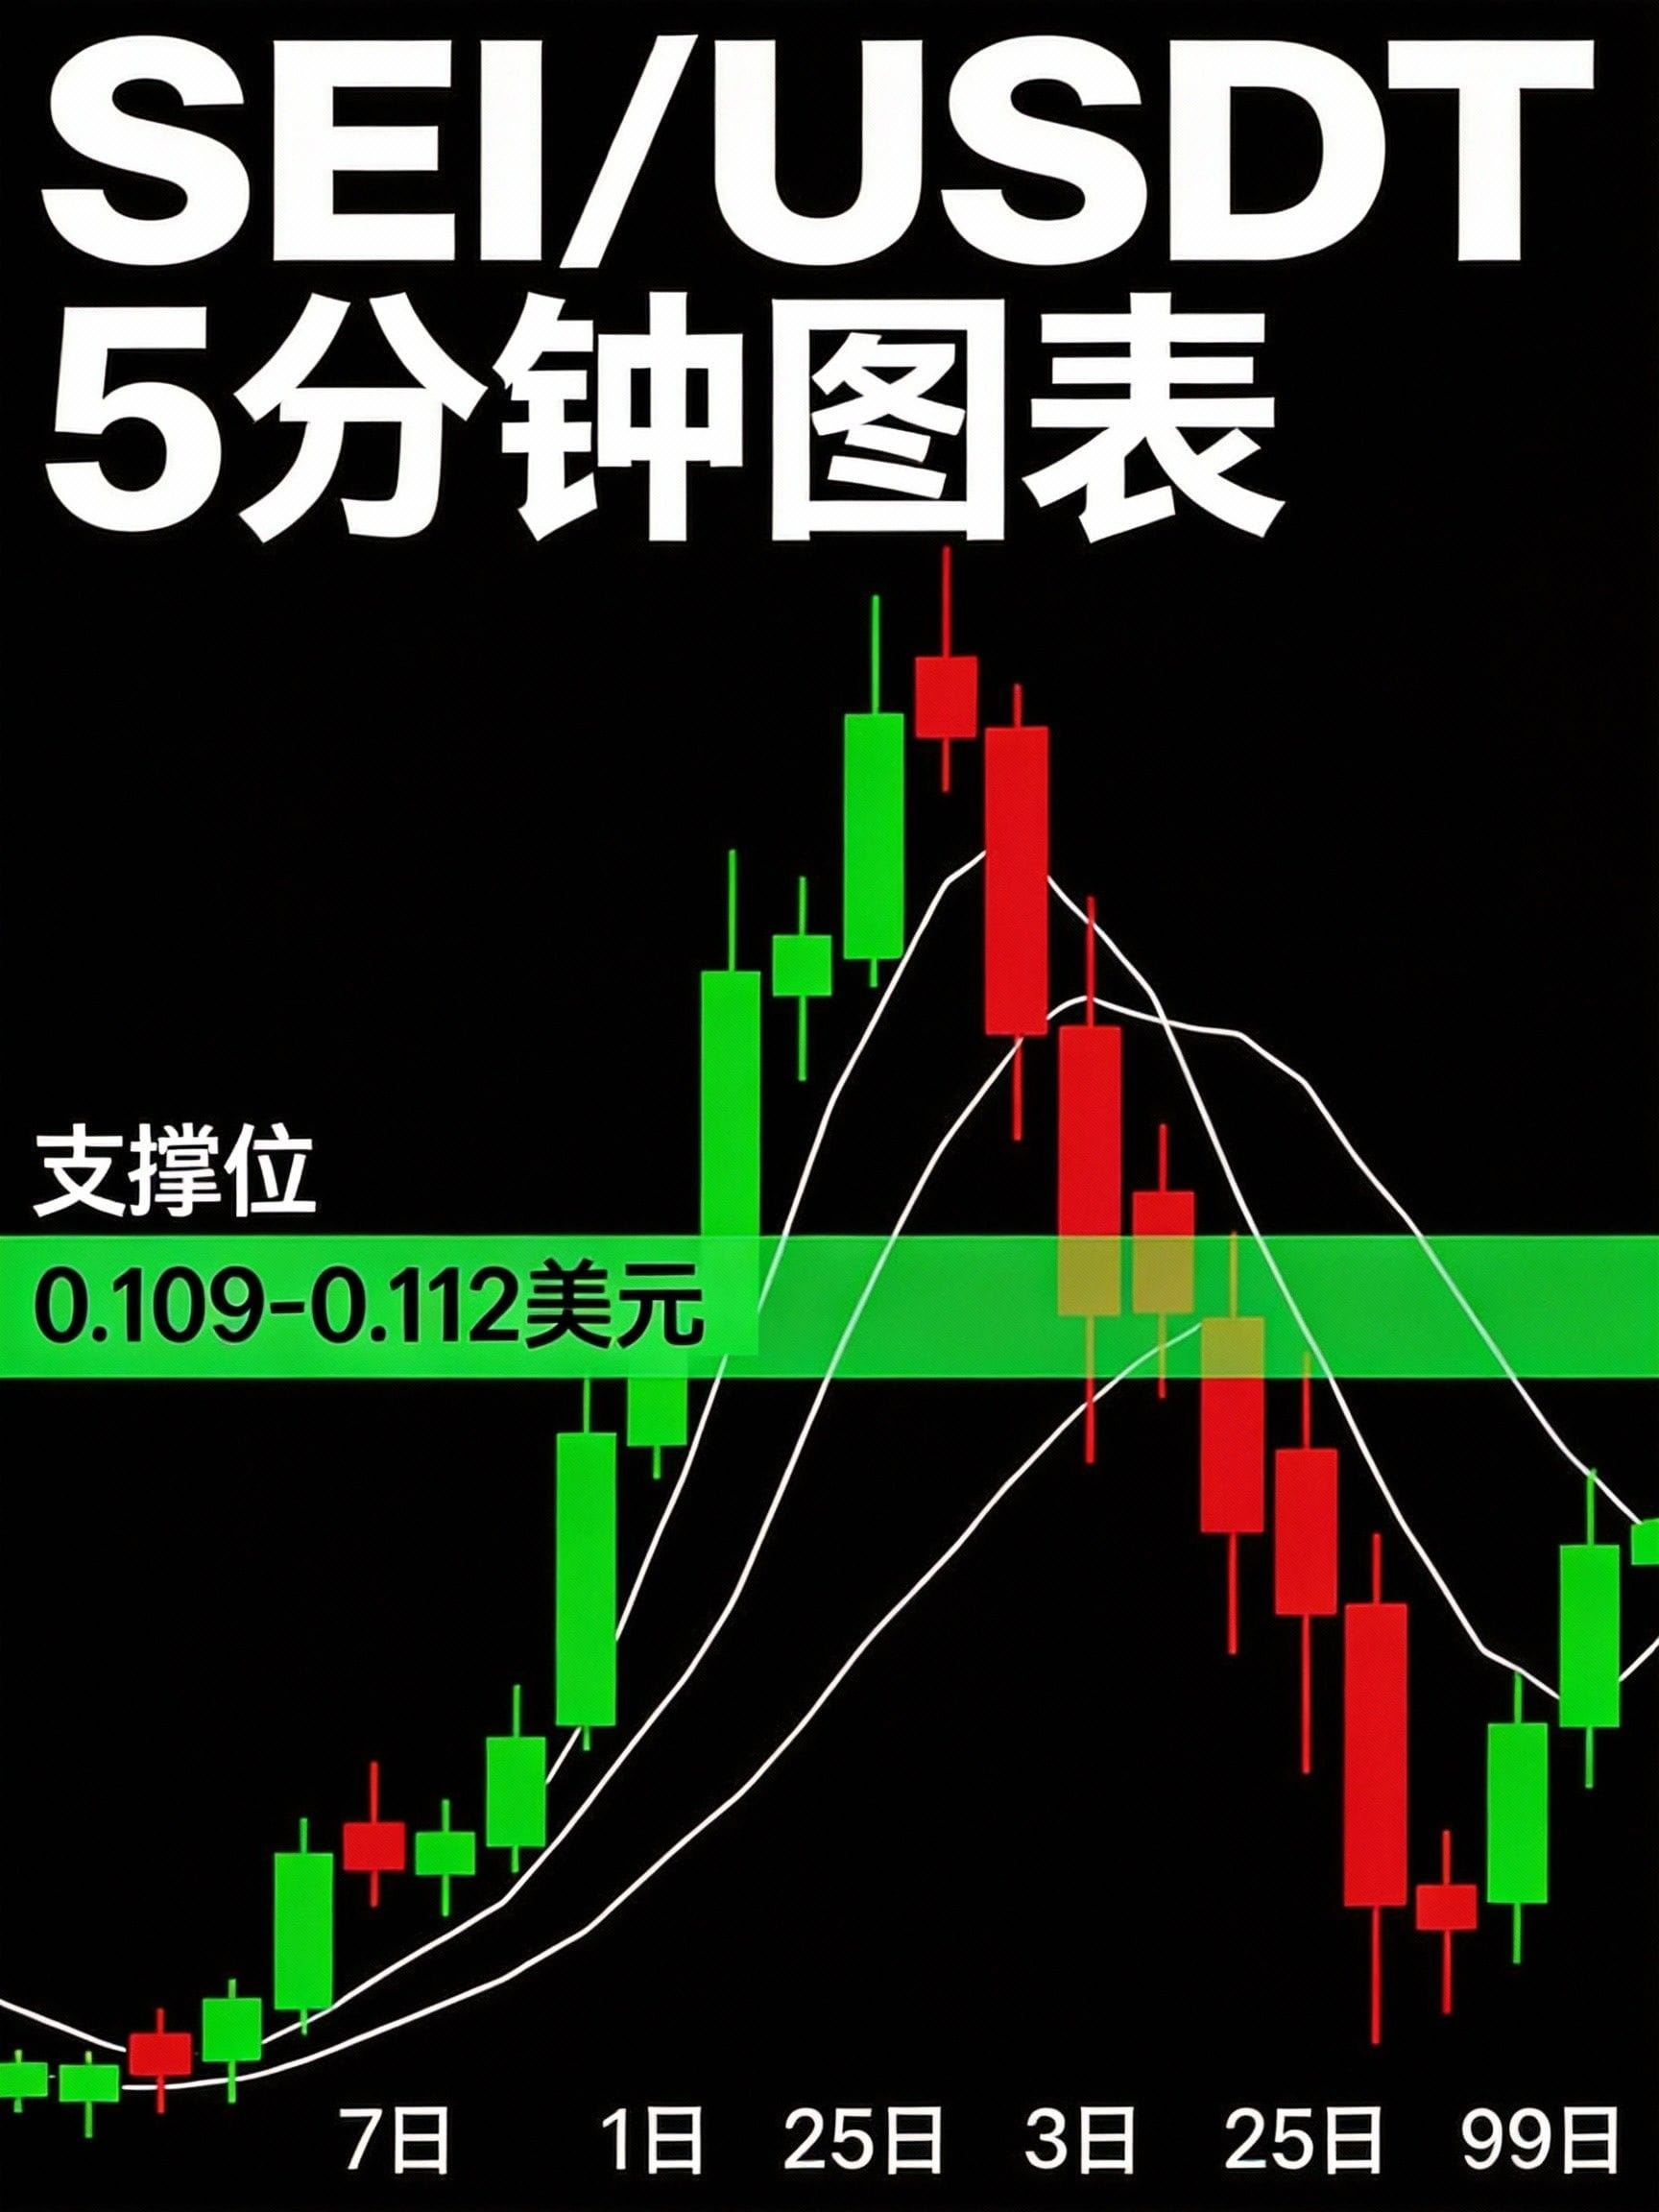
Figure 1: $SEI/USDT 5-minute candlestick chart, overlaying 7-day, 25-day, and 99-day moving averages. Support platform formed at $0.109-$0.112.
In-depth interpretation of technical indicators: MACD, RSI, moving average system
MACD analysis: Key node for momentum shift
The MACD fast and slow lines on the 5-minute chart have attempted three golden crosses below the zero axis. The market's drag led to failure, but the histogram's shrinkage is significant—downward momentum is weakening. The price low ($0.109) and MACD low show a 'bottom divergence,' which is usually a precursor to reversal.
RSI analysis: Repeated tests in the oversold area
The 14-period RSI has touched the oversold area below 30 three times (lowest 28.5), each time quickly pulled back. Its performance is stronger than BTC; when the market breaks down, SEI can still hold in the 28-32 range. This relative strength is precious in a bear market.
Moving average system: Short-term under pressure, long-term trend intact
7-day moving average: $0.112 (pressure)
25-day moving average: $0.115 (strong pressure)
99-day moving average: $0.108 (strong support)
The price is above the EMA99, and the long-term uptrend line (connecting the low of $0.095 in December 2025 and the low of $0.105 in January 2026) has not been broken. As long as the support at $0.108 holds, the medium to long-term trend is upward.
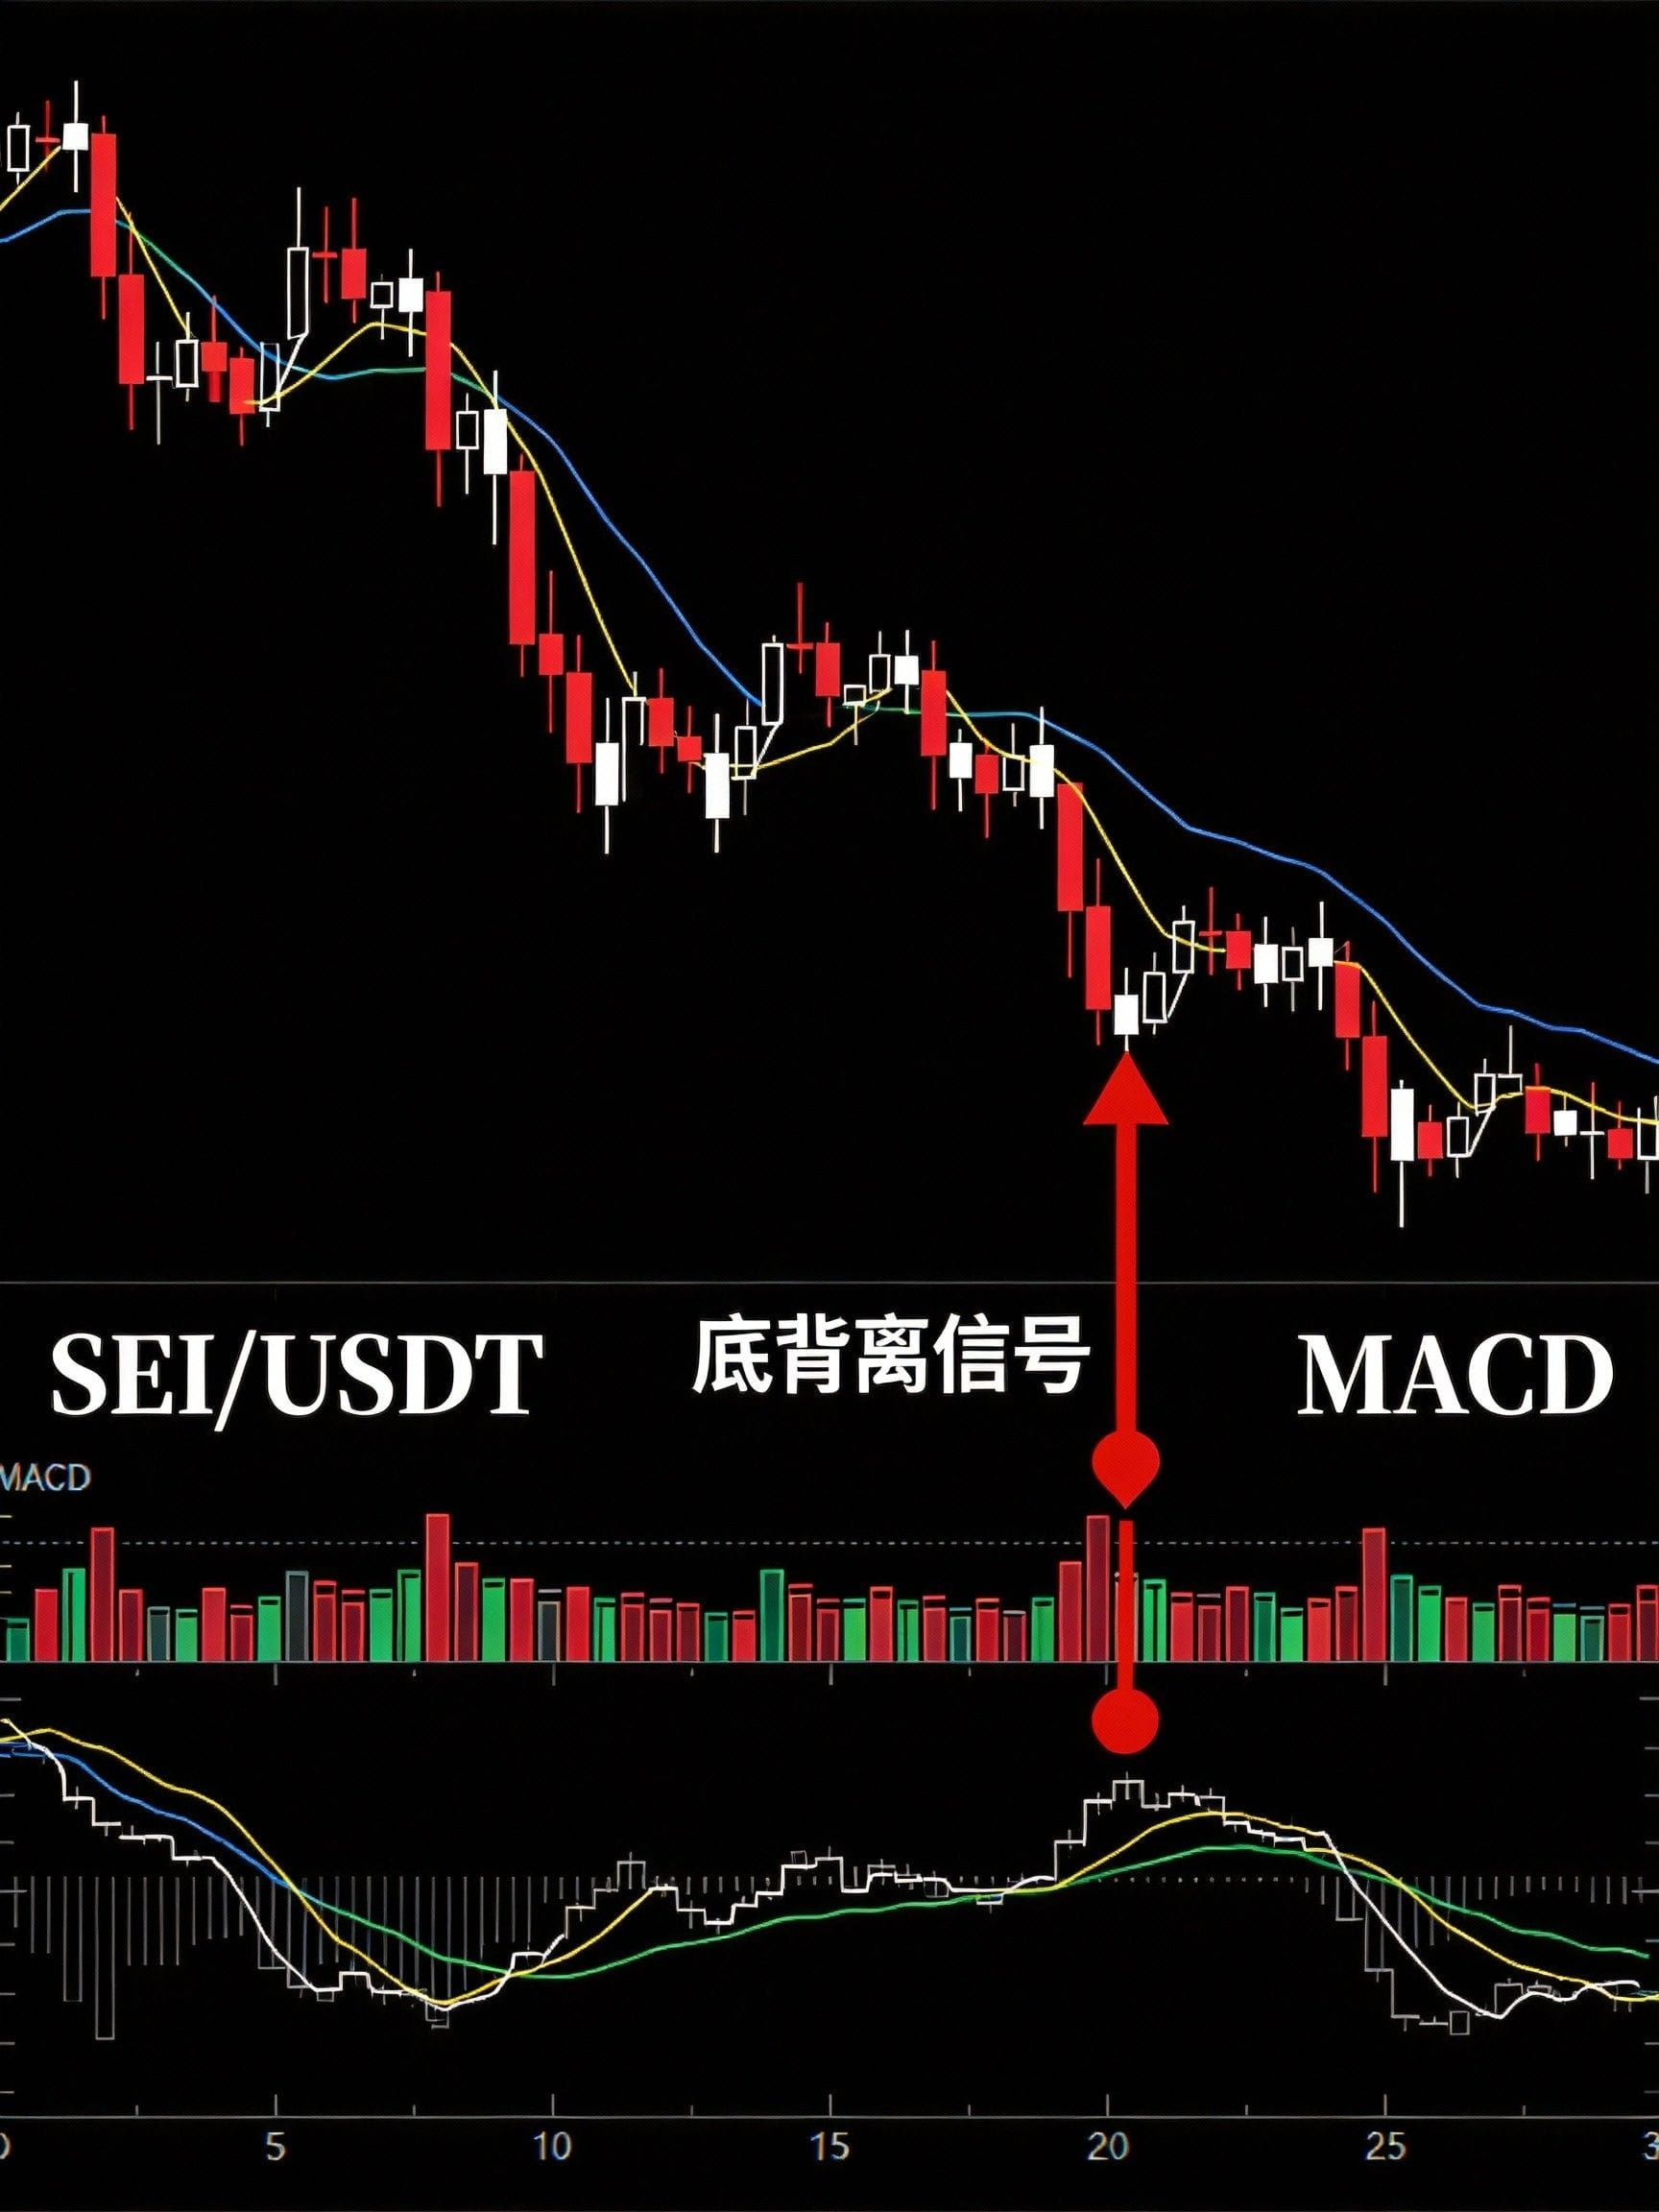
Figure 2: $SEI MACD bottom divergence area, the fast line begins to flatten.
Multi-timeframe analysis
5-minute chart: Double bottom prototype
A 'double bottom' prototype appears near $0.109; breaking $0.112 (neckline) can look for $0.115 (about 3% upside).
1-hour chart: Descending wedge
Constructing a 'descending wedge,' combined with RSI bottom divergence, increases the likelihood of a breakout.
Daily chart: The upward channel remains intact
Still in an upward channel, with the lower boundary at $0.105 and the upper boundary at $0.135. Today's drop is just a retest of the mid-channel ($0.110).
Operation strategy and risk management
Core view
$SEI Fundamentals (on-chain data) and technicals (indicator divergence) are showing a rare 'resonance.' Despite the harsh market conditions, this resonance may bring opportunities for excess returns.
Specific operations
Position building range: $0.109-$0.111
First target: $0.115 (breakthrough of the 25-day moving average)
Second target: $0.120 (previous high resistance)
Stop-loss level: $0.105 (break below the daily channel lower boundary)
Position management
Important reminder: It is a niche cryptocurrency with high volatility. It is recommended to intervene only after the market stabilizes at $87,000 BTC.
Risk warning
Market risk: If it falls below the dollar, SEI will find it hard to stand alone.
Liquidity risk: The buy-sell spread of niche cryptocurrencies may be large.
Project risk: The Giga upgrade of Sei Network is ongoing, and technical risks need to be monitored.
Summary: Opportunities in crisis
The market crash causes panic, but it is precisely at such times that we can see which projects have real value. The user growth, cost advantages, and indicator divergence of $SEI are worth focusing on.
Investment must always control risk: 5% position limit, strict stop-loss, gradual building of positions—these disciplines are more important than any analysis.
Follow Xiaohai for insights on the crypto circle, interpreting cryptocurrency technical analysis for you every day. Let's learn together in the bear market and reap rewards in the bull market.
Disclaimer: This article is only a technical analysis sharing, not an investment advice. The cryptocurrency market is highly risky, please make decisions cautiously.


