When the spot gold price was fixed at $5111.15 this afternoon, the entire financial market fell into a frenzy. The green numbers flashing on the screen, a 2.22% increase for the day, and a single-day surge of over $110 led to the claim that "the gold bull market has no ceiling" trending on social media, with even retail investors shouting lofty predictions of "hitting $6000 within the year."
Many retail investors only see the soaring gold prices, but overlook the dangerous signals behind the market. From the perspective of professional traders, the current gold market has already sown the seeds of a correction.
From a technical indicator perspective, the rise in gold has already entered the "irrational zone." The daily K-line has consecutively posted 8 bullish candles, with the divergence ratio (BIAS) exceeding 20, reaching its extreme in nearly three years, indicating that the gold price has severely deviated from the moving average support and is facing a technical correction at any time.
More critically, the MACD indicator has shown a clear top divergence at the 5100 level—gold prices continue to hit new highs, but the red bars of MACD are shortening, and the momentum bars are showing a declining trend. This is like a car that has accelerated to its limit, with the engine power unable to keep up with the speed; braking is just a matter of time.
Meanwhile, from the K-line pattern perspective, today's large bullish line has a significant 'long upper shadow', indicating that there is considerable selling pressure at the 5111.15 position, and the main funds have quietly begun to distribute chips at high levels.
The core logic of this round of gold rise boils down to two points: geopolitical conflicts and expectations of interest rate cuts by the Federal Reserve. However, currently, both of these favorable factors have already been 'overdrawn' by the market.
In terms of geopolitics, recent regional conflicts have not shown substantial escalation, and market risk aversion has remained high. Unless extreme events occur, it will be difficult to provide new upward momentum for gold prices. Additionally, the expectation of interest rate cuts by the Federal Reserve has already been repeatedly speculated—from the initial 'six rate cuts this year' to now 'three rate cuts', the market's expectations for monetary policy are gradually returning to rationality, weakening the 'rate cut logic' that supports gold price rises.
The main funds are taking advantage of the retail investors' psychology of 'buying expectations and selling facts' to create the illusion that 'the market can still rise' at points where good news has been fully digested, attracting retail investors to take over.
From the COMEX gold futures holding data, it is clear that the movements of large speculative institutions (hedge funds) are undergoing a reversal. As of last Friday, the number of long positions held by hedge funds decreased by 123,000 contracts, while the number of short positions increased by 87,000 contracts—this is the largest scale of 'long to short' operations by institutions in nearly half a year.
At the same time, the retail investors' holding data shows that the proportion of retail holdings has surged to 78%, setting a record high. This type of capital structure of 'institutional withdrawal, retail entry' has historically been a precursor to market reversals.
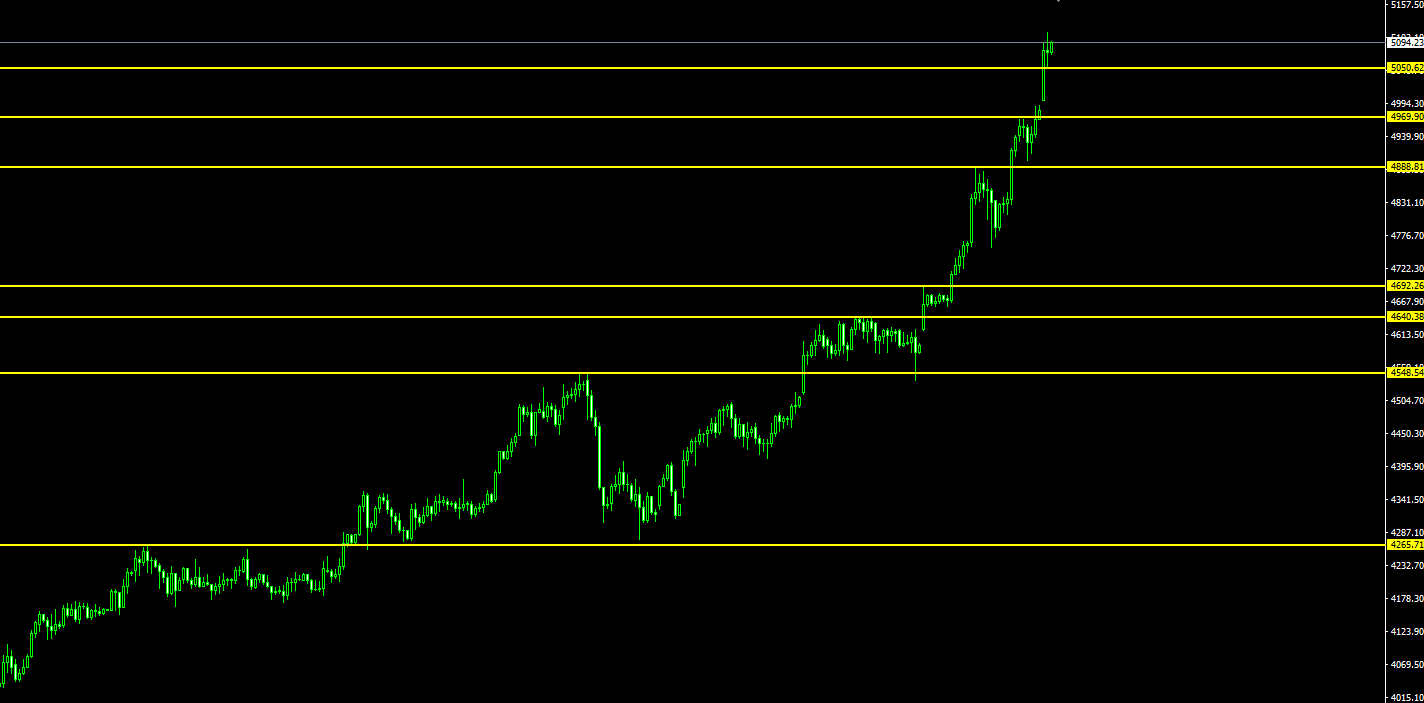
The starting point of this round of gold rise is $3628.04, and the endpoint is $5111.15, with a total increase of $1483.11. According to the Fibonacci 61.8% retracement ratio, the reasonable retracement target for gold is around $4580, which closely overlaps with our predicted range.
Previous support level verification: the 4400-4600 range is the 'trading density area' where gold fluctuated repeatedly in the first half of 2025, and it is also an important cost area for main funds. This range has accumulated a large number of buy orders, and once the gold price retraces to this level, it will form strong support, which is difficult to break easily.
More importantly, this retracement does not signify the 'beginning of a bear market', but rather a mid-term adjustment within a bull market. The main forces are using the retracement to wash out floating chips, preparing for the next round of rise. The 4400-4600 range will be the most cost-effective 'bottom-buying area' in the gold market this year.
Buffett once said: 'I am fearful when others are greedy, and greedy when others are fearful.'
When the entire market is cheering for the new high of 5100, we must remain calm. Gold has never been an asset that only rises without falling; after every historical high, there will be corresponding retracements. This is not a risk, but an opportunity— for rational traders, the retracement is the best time to pick up cheap chips.
Remember, the essence of trading is not 'chasing highs and killing lows', but 'predicting trends and laying out in advance'.
Pay attention to the trends; in the coming days, I will continue to track the gold market and steadily grasp every wave of the market in the spot gold market!