
Bitcoin faces rejection risk near $88,000 amid significant outflows from ETF funds

The price of Bitcoin is struggling near the previously broken midpoint of a parallel horizontal channel at $87,787 on Monday.
U.S.-listed spot ETFs recorded outflows of $1.33 billion last week, the second-highest weekly withdrawal since their launch.
Bitcoin profit dynamics have turned negative, indicating a shift in the system from profit-taking to loss realization over the past thirty days, according to the report.
Bitcoin price ($BTC ) is recovering slightly, trading near the previously broken midpoint of a parallel horizontal channel around $88,000 at the time of writing this report on Monday, after declining over 7% in the previous week. The bearish outlook is reinforced as Bitcoin spot ETFs recorded outflows exceeding $1.3 billion, marking the second-highest weekly withdrawal since their launch. Additionally, the CryptoQuant report highlights that the profit dynamics of the cryptocurrency king have turned negative, indicating weakness in the near term.
Weak institutional demand, fueling price declines
Weak institutional demand for $BTC last week. According to SoSoValue data, Bitcoin spot ETFs recorded total outflows of $1.33 billion in the previous week, marking the second-highest weekly withdrawal since their launch. If these outflows continue and worsen, Bitcoin may experience further correction.
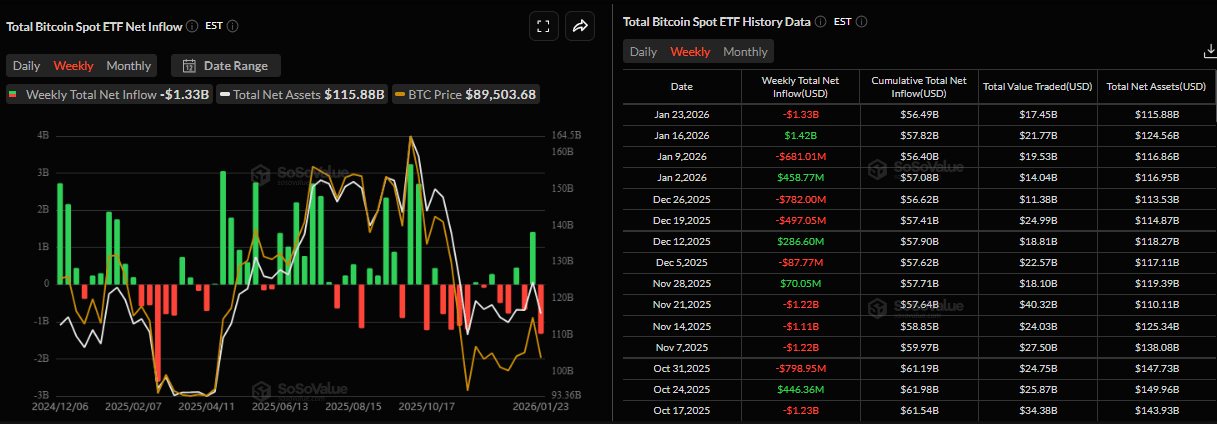
Chart of net inflow for Bitcoin spot ETFs. Source: SoSoValue
Next week
QCP Capital reported on Monday that the cryptocurrency market traded in a narrow range over the weekend before facing pressure during the early hours of the Asian session, leading to the liquidation of more than $550 million in leveraged long positions.
The analyst explained that the move toward risk aversion seems to have been driven by a convergence of macro developments. These developments include comments from US President Donald Trump regarding the possibility of imposing 100% tariffs on Canadian imports, renewed concerns about a partial shutdown of the US government, and ongoing uncertainty regarding potential coordinated intervention between the US and Japan to stabilize the yen.
"Looking ahead, implied volatility is likely to remain elevated amidst an intense calendar of macro events. In addition to ongoing geopolitical and financial headlines, markets are facing significant technical earnings and a policy decision from the Federal Reserve on Wednesday. While it is widely expected that the Fed will keep interest rates steady, investors will be on the lookout for Jerome Powell's guidance on the policy path in the coming months. With multiple unresolved macro risks, cryptocurrency prices are likely to fluctuate in the near term, awaiting greater clarity, particularly around the risk of a US government shutdown," concluded the QCP Capital analyst.
System shift
The weekly CryptoQuant report highlighted a shift in Bitcoin market structure, as Bitcoin profit dynamics turned negative, indicating a transition from profit-taking to loss realization.
The chart below shows that Bitcoin holders began realizing net losses in December 2025 for the first time since October 2023. Since December 23 of last year, holders have incurred cumulative losses of approximately 69,000 Bitcoin over the past thirty days. Furthermore, realized profit peaks have been declining since March 2024, indicating that prices are losing momentum as the bull market ends.
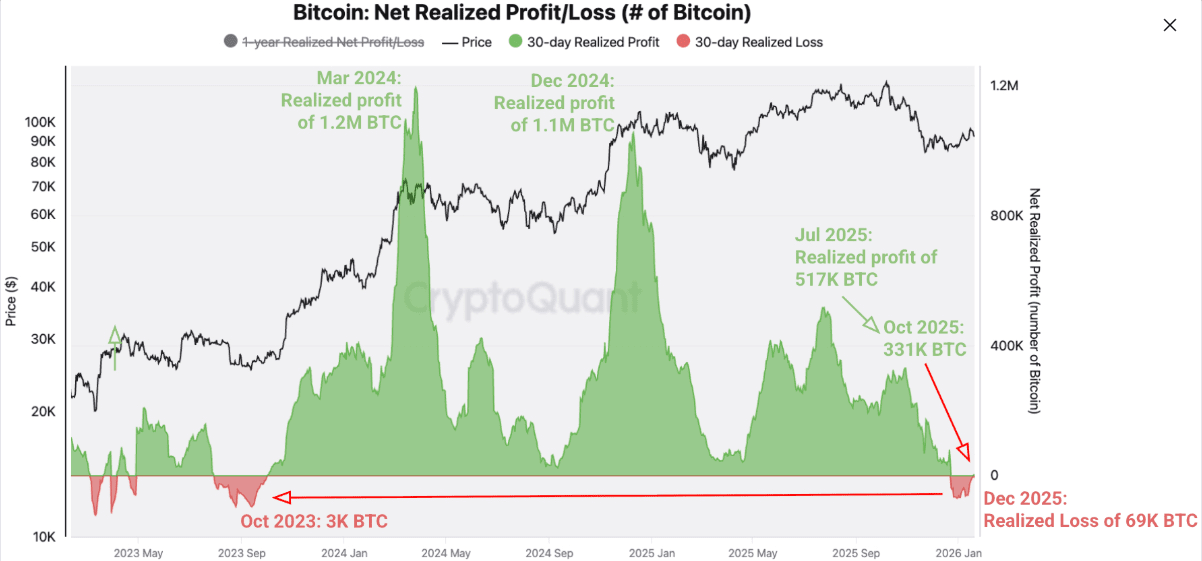
Chart of Bitcoin's net realized profit loss over the past 30 days. Source: CryptoQuant
The current pattern closely mirrors that which occurred during the transition from a bull market to a bear market in 2021-2022, when realized profits peaked in January 2021, forming lower peaks throughout 2021, before turning into net losses ahead of the bear market in 2022.
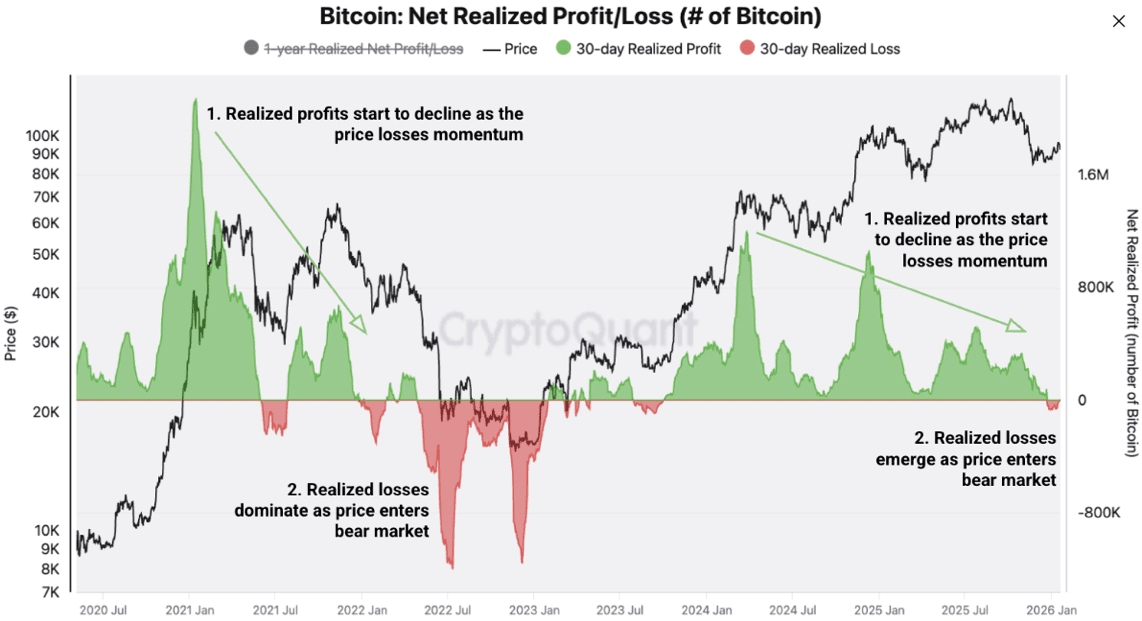
Chart of Bitcoin's net realized profit loss over the past 30 days. Source: CryptoQuant
Bitcoin price forecast: Bitcoin momentum indicators show bearish signs
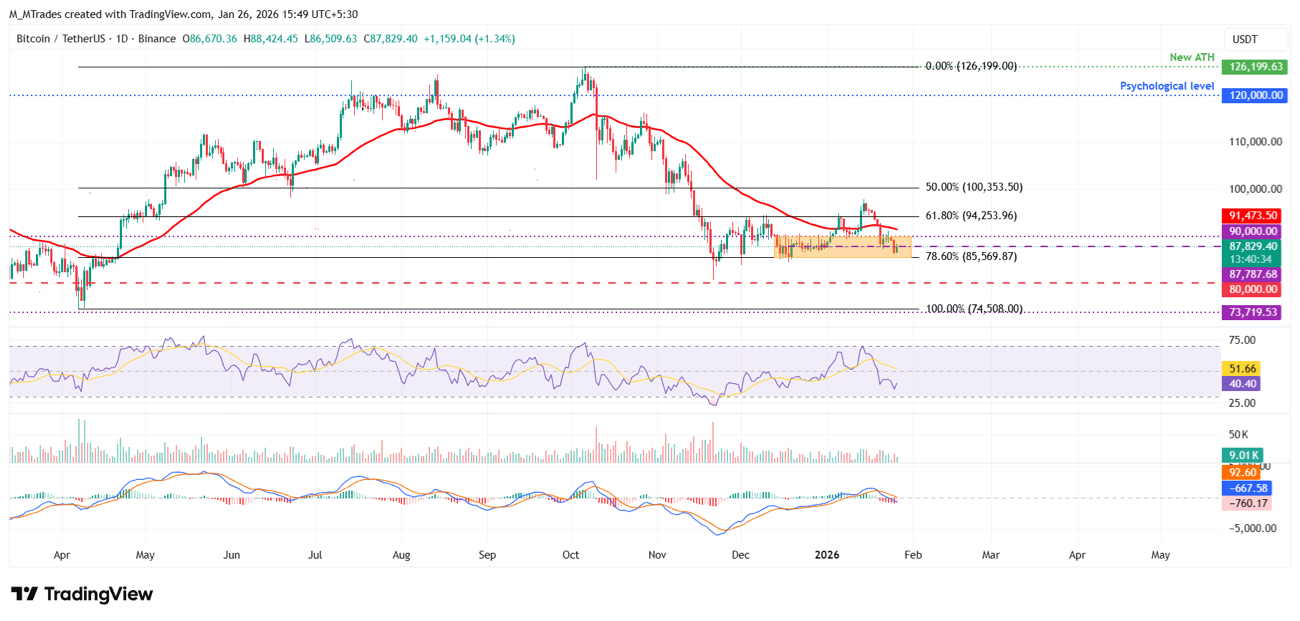
The price closed below the midpoint of a parallel horizontal channel at $87,787 on Sunday, after a 7.4% correction last week. At the time of writing this report on Monday, Bitcoin is recovering slightly, approaching this broken level.
If Bitcoin fails to close above $87,787, the decline may extend towards the lower boundary of the consolidation at $85,569, which coincides with the 78.6% Fibonacci retracement level.
The Relative Strength Index (RSI) on the daily chart is 40, below the neutral 50 level, indicating a gaining bearish momentum. Traders should remain cautious, as the Moving Average Convergence Divergence (MACD) also showed a bearish crossover last week and has remained in effect, indicating a downward movement.
Daily chart of the BTC/USDT pair
On the other hand, if Bitcoin breaks and closes above $87,787 on a daily basis, the recovery may extend towards the upper boundary of the horizontal pattern at $90,000.
#BTC走势分析 #BinanceSquareFamily #BinanceSquare #BinanceSquareBTC #BTC