Japanese candlesticks are considered the official and sole language of the market, but many traders make the critical mistake of focusing solely on the candle body and neglecting the wicks/shadows. The truth is that the candle's wick tells the story of the struggle between bulls and bears, and it's the real key to understanding where liquidity lies and where the price will move next. In this guide, we'll delve into the lower and upper wicks and their technical significance. 📊
Like 👍, follow 🫂, and comment 💬 so we can continue posting content like this ⚠️🥶
🔹 **Understanding the Philosophy of the Candlestick: What Happens Behind the Scenes?** 🔹
A candlestick wick isn't just a thin line; it's the area where the price reached a certain point over a specific period and was then strongly rejected. When the price leaves a long wick, it clearly tells you: we tried to go this far, but the other side was stronger and pushed us back. Therefore, we can think of wicks as the fingerprints of a market maker, indicating areas of price rejection and suppressed momentum. 🔍
📈 **Lower Wicks: The Hidden Power of Bulls** 📈
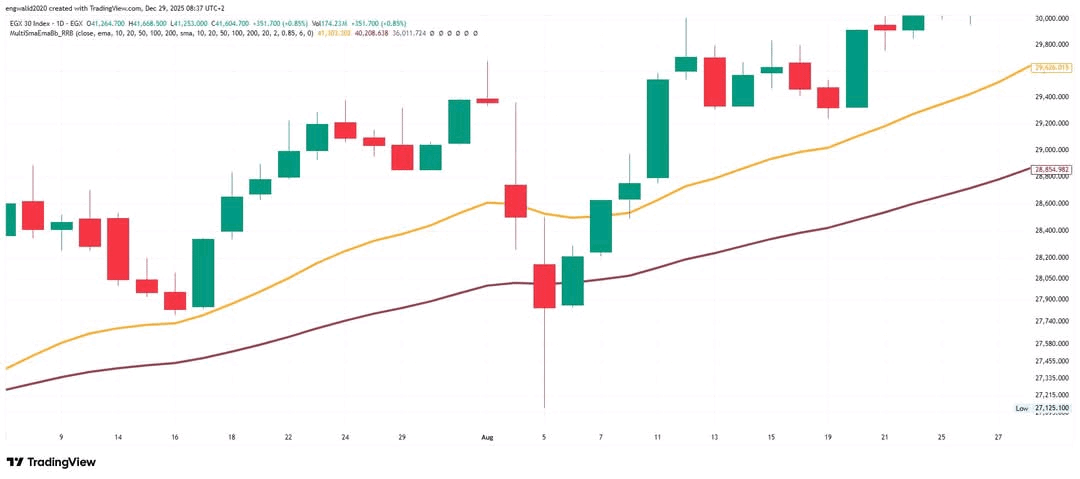
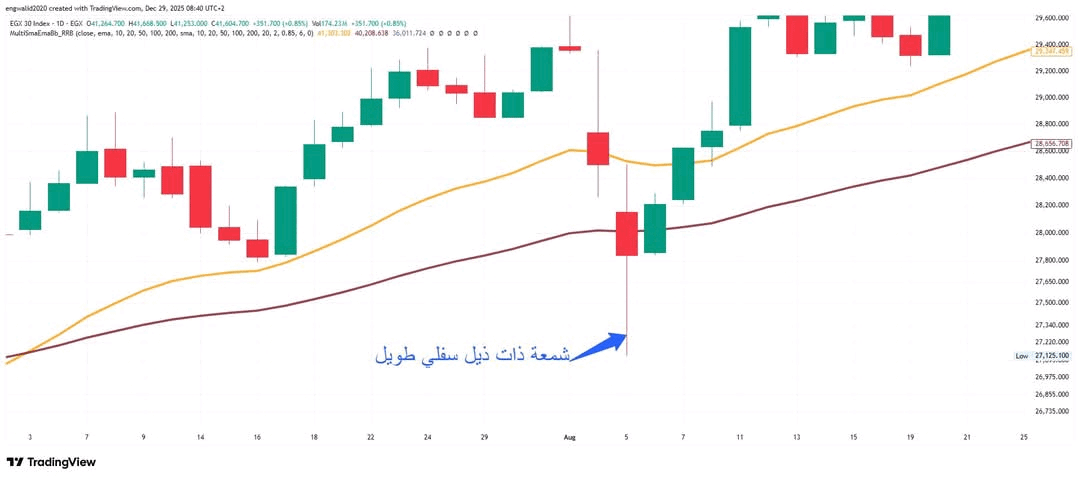
A long lower wick is one of the most attractive sights a buyer can see on a chart. Its meaning is clear: the price fell, sellers were in control for a while, but before the candle closed, buyers intervened with tremendous buying power and pushed the price back up.
* **Technical Interpretation:** This indicates a bearish rejection. If a long lower tail appears at a strong support level, it means the market is preparing to rise, and the Hammer candlestick pattern is the most common example of this.
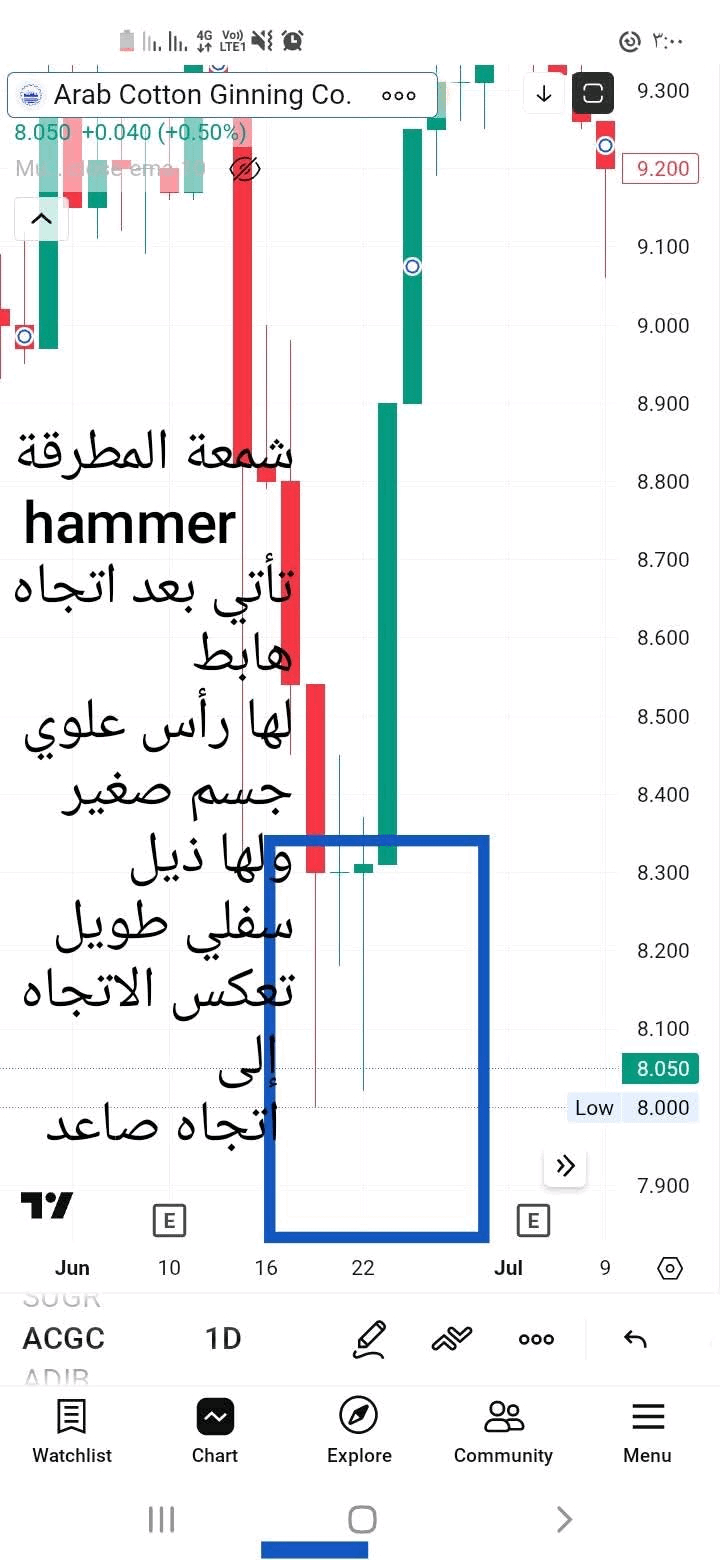
* **How to trade it?** Look for consecutive lower tails at the end of a downtrend; this is a sign that sellers are exhausted and the trend is about to reverse upwards. 🚀
📉 **Upper Wicks: Steel Resistance Wall** 📉
Conversely, the upper tail indicates that buyers failed to maintain high levels. The price rose, but encountered a wall of sell orders that pushed it down.
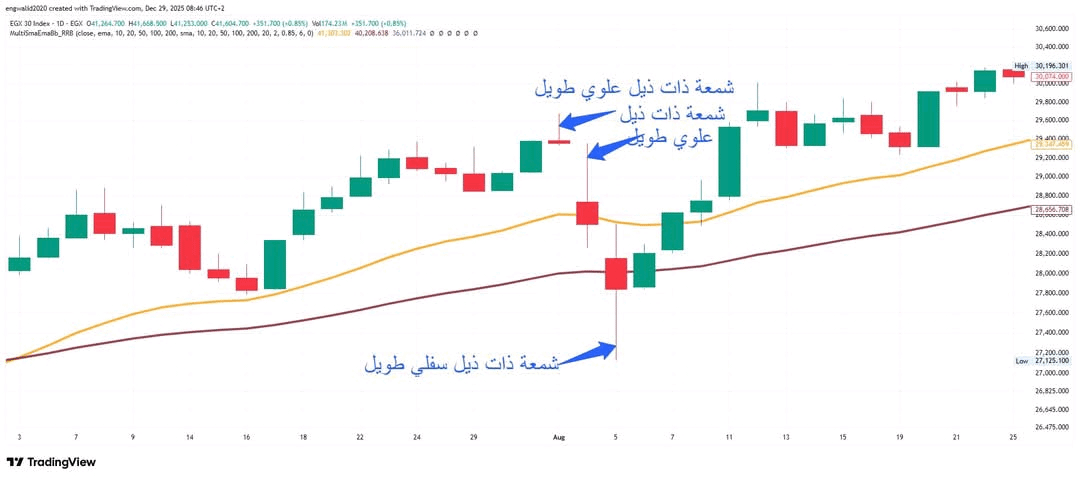
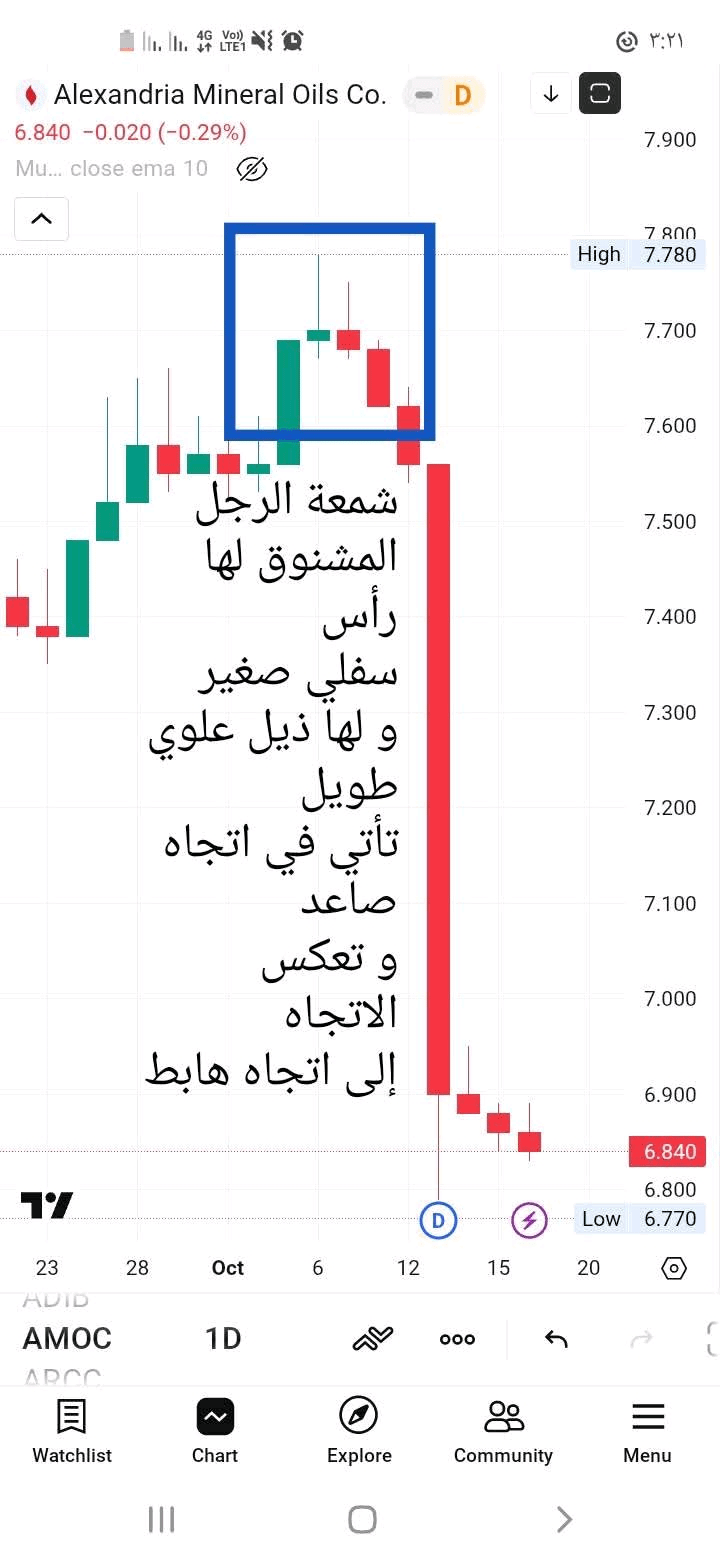
* **Technical Interpretation:** This indicates a bullish rejection. When you see a long upper tail at a peak or resistance level, the market is sending you a warning message that the buying momentum has ended and a downward move is inevitable. The Shooting Star candlestick pattern is the perfect example here.
* **Pro Tip:** A long upper tail after a sharp rise is often a signal of selling by large investors. ⚠️
🎯 **Tail-to-body ratio: The secret to successful trading** 🎯
The tail should not be viewed in isolation from the candle body. The golden rule states: the longer the tail is relative to the candle body, the stronger the reflective signal.
* **Small body and long tail:** This signifies extreme confusion in the market, often ending in a price explosion in the opposite direction of the tail.
* **Double-sided tails (Doji):** This indicates a balance of power, signaling a pause and observation until the price breaks out of one of the extremes. 🛡️

💡 **Advanced Strategies for Using Tails in Trading** 💡
To increase the success rate of your trades using tails, you should combine them with other tools:
1. **Tails and Supply and Demand Zones:** A tail that breaks through a supply zone and then closes below it is a golden sell signal (False Breakout).
2. **Timeframes:** Tails on larger timeframes (weekly, daily, 4 hours) have much higher reliability than tails on smaller timeframes.
🌟 **Summary: Learn to read between the lines** 🌟
Mastering the art of reading upper and lower wicks is the difference between a successful trader and a haphazard one. The wicks tell you the real story before it even appears in the news. Start today by opening your chart and observing how the price respects long wicks at reversal points, and you'll discover that the market is speaking to you quite clearly. Always remember: the body tells you where the price closed, but the wick tells you who won the battle. 🕯️
If you're not familiar with using it, please write to us in the comments with your questions.
If you found this article helpful, share it with your friends so that everyone can benefit.
#الشموع_اليابانية #التحليل_الفني #أساسيات_التداول #تعليم_تداول #CandlestickPatterns $BTC

