
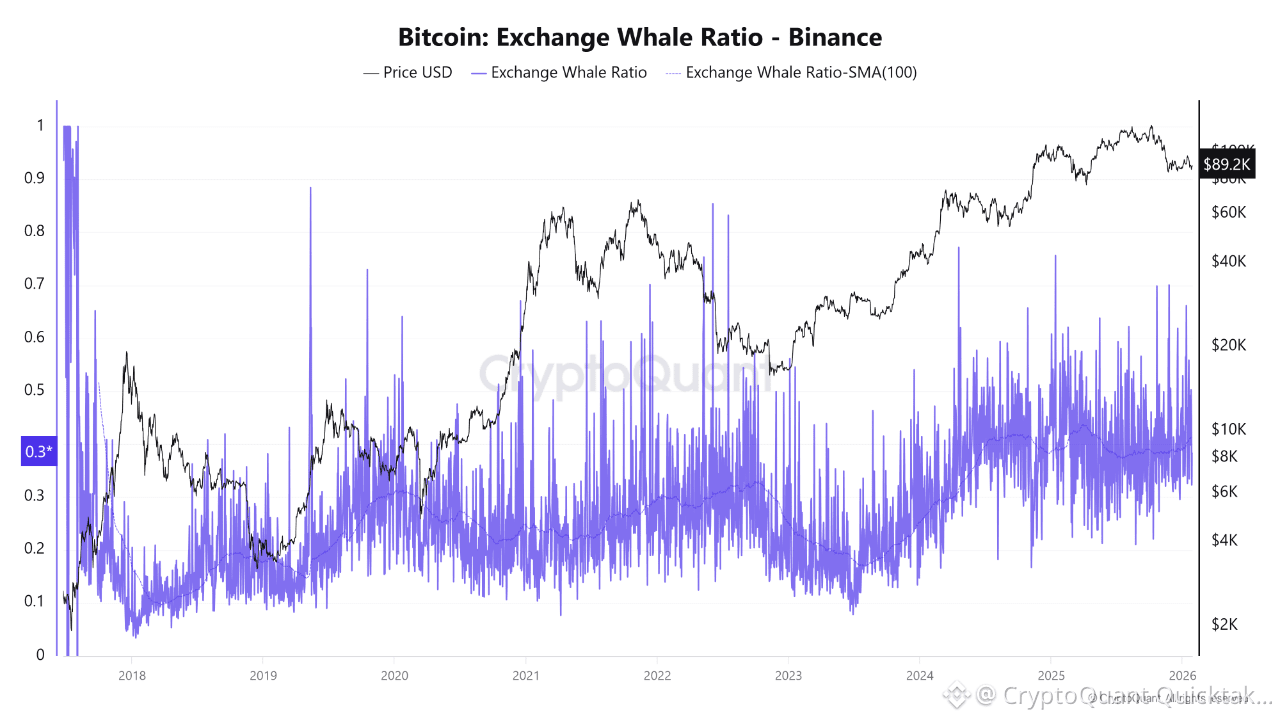
The chart reveals a clear and recurring behavior. When the Whale Ratio rises, price reactions typically unfold in three stages. In the first stage, price remains strong while the Whale Ratio increases. During this phase, price often continues to rise or moves sideways because selling pressure has not yet been priced in.
In the second stage, as the Whale Ratio reaches elevated levels and stays high, distribution from the top begins. Price usually forms a local top and enters a sharp correction. The higher and more persistent the Whale Ratio, the stronger the downside reaction that follows.
The third stage is characterized by increased volatility. Sudden pullbacks and sharp wicks appear, making conditions risky for long positions.
When the Whale Ratio is at low levels, selling pressure is minimal. Price either moves sideways in an accumulation phase or starts a controlled upward trend. Especially after the Whale Ratio forms a bottom, price tends to consolidate briefly before breaking to the upside. Low Whale Ratio consistently creates a foundation for bullish moves.
Looking at the current situation, the Whale Ratio is neither at extreme highs nor at historical lows. It remains above its SMA(100) but within a manageable range. This suggests that whales are no longer engaging in aggressive selling, instead opting for gradual distribution. As a result, price action reflects a sideway to mildly bearish structure rather than a full accumulation phase.
At this Whale Ratio level, the probability of a sharp dump is low, but the likelihood of a strong rally is also limited. Upside moves are likely to remain corrective, while declines progress in a sideways manner. A decisive trend change would require a sharp move in the Whale Ratio either upward or downward. Given ongoing institutional involvement, such a shift does not appear likely in the near term.
The key driver for the next major price move will be the direction in which the Whale Ratio breaks from here.
Written by PelinayPA