
$BTC and spot ETFs have been moving in lockstep.
And there’s one line that separates a nasty correction from a deeper bear phase. ⚠️
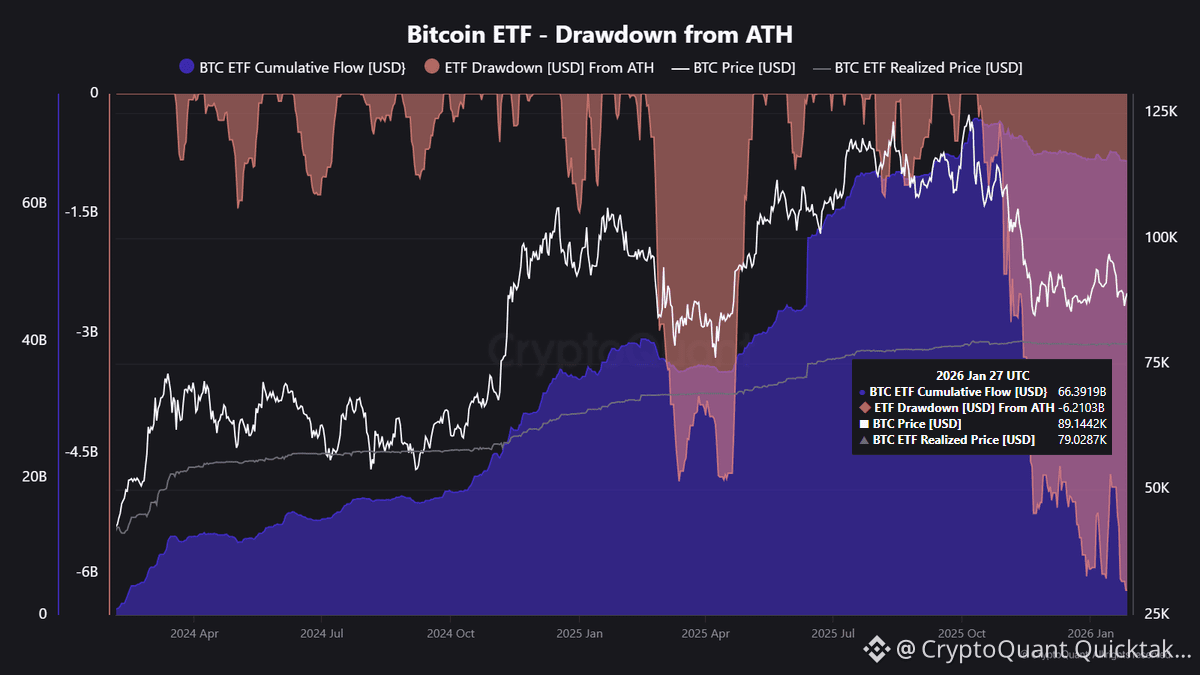
📊 CryptoQuant chart:
🔹 BTC ETF cumulative flow: +$66.4B
🔹 Drawdown from ATH: -$62.1K
🔹 BTC ETF realized price (cost basis): ~$75K
🔹 BTC spot: ~$89K
🧠 What it means:
• 2024-2025 = steady ETF accumulation.
• Price rose with inflows. The relationship is clear.
• After the ATH, inflows stopped building while price kept bleeding. Demand cooled.
⚠️ The real risk:
Lose ~$75K (ETF cost basis), and a big chunk of ETF buyers turn underwater. That’s where selling pressure can snowball.
🧭 Levels I’m watching:
🟢 Support: ~$75K
🔴 Resistance: ~$100K
📌 Takeaway: Above ~75K = ugly correction. Below ~75K = bear risk jumps.
Written by IT Tech