
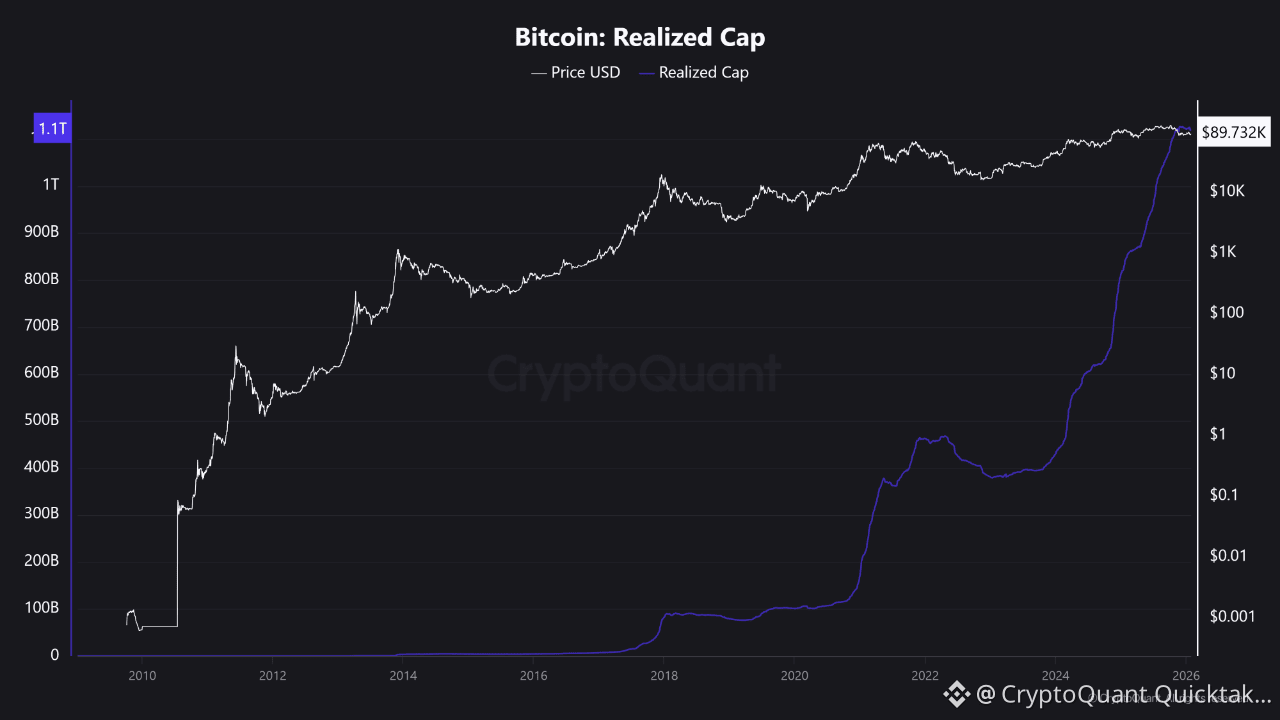
Looking at the Realized Cap, we can see that it has surged sharply in this cycle and is now approaching Bitcoin’s Market Cap.
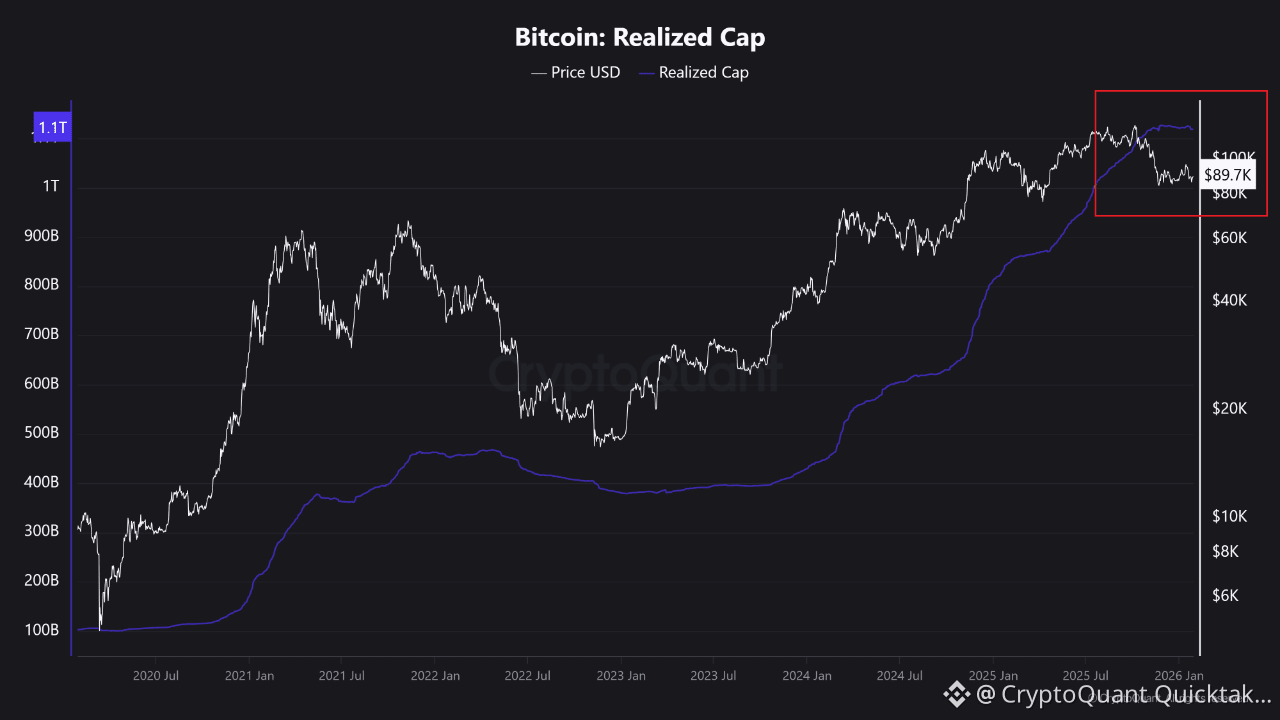
The first chart shows the full historical period, and the second chart focuses on the period after the COVID crash and the peak around the 3rd halving cycle.
(Bitcoin Realized Cap)
The fact that the Realized Cap has recently moved close to the Market Cap suggests that long-dormant Bitcoins have been transferred to exchanges and sold.
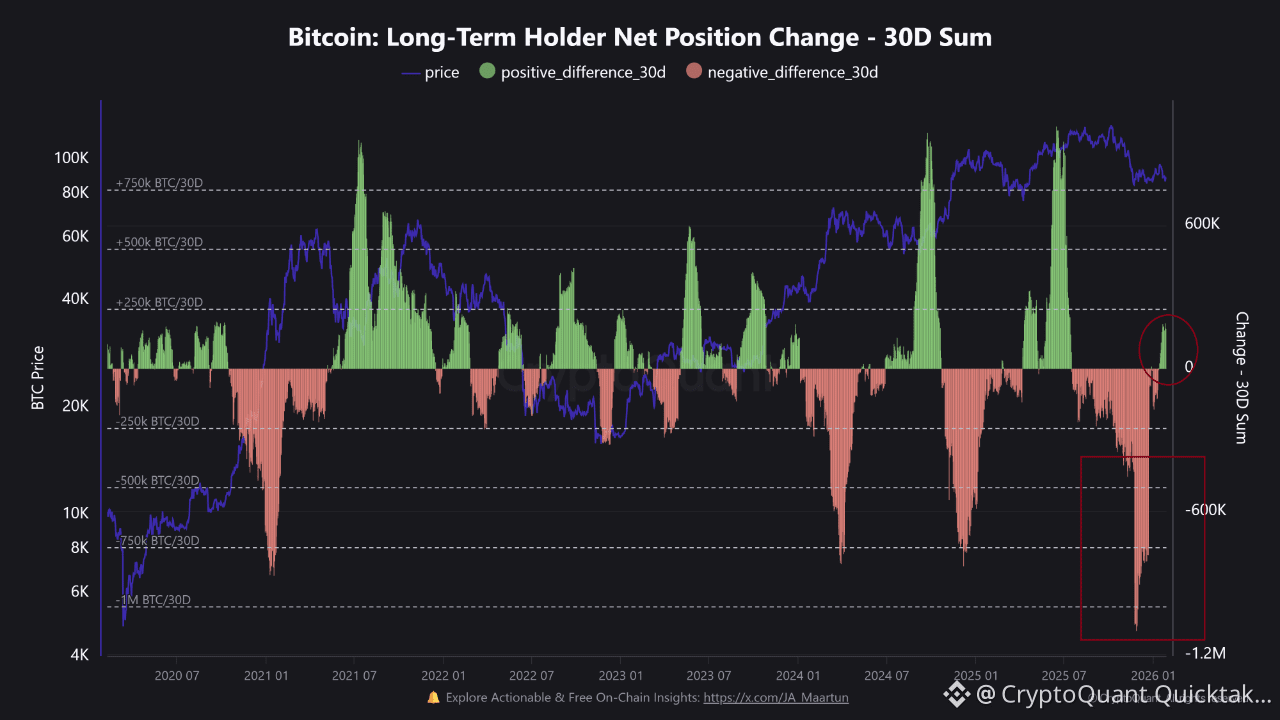
The third chart shows the buying and selling behavior of long-term holders.
(Bitcoin Long-Term Holder Net Position Change – 30D Sum)
In fact, OG whales seemed to want to end this 4th cycle in November.
As highlighted in the red box, they attempted a strong distribution phase, but failed and eventually stopped selling.
The red circle indicates that they have recently started accumulating again, albeit gradually.
Historically, whenever long-term holder accumulation has accelerated, a bull market has followed. This pattern can also be confirmed in previous cycles on the same chart.
This trend is further supported by the LTH Net Position Change on-chain metric.
Therefore, it is still highly likely that the Bitcoin cycle has not yet ended.
Written by CoinNiel