The chart shows that we have broken the lower boundary of the ascending channel. If we look more locally, a 'bear flag' pattern has formed. After that, the price returned to test the resistance boundary.
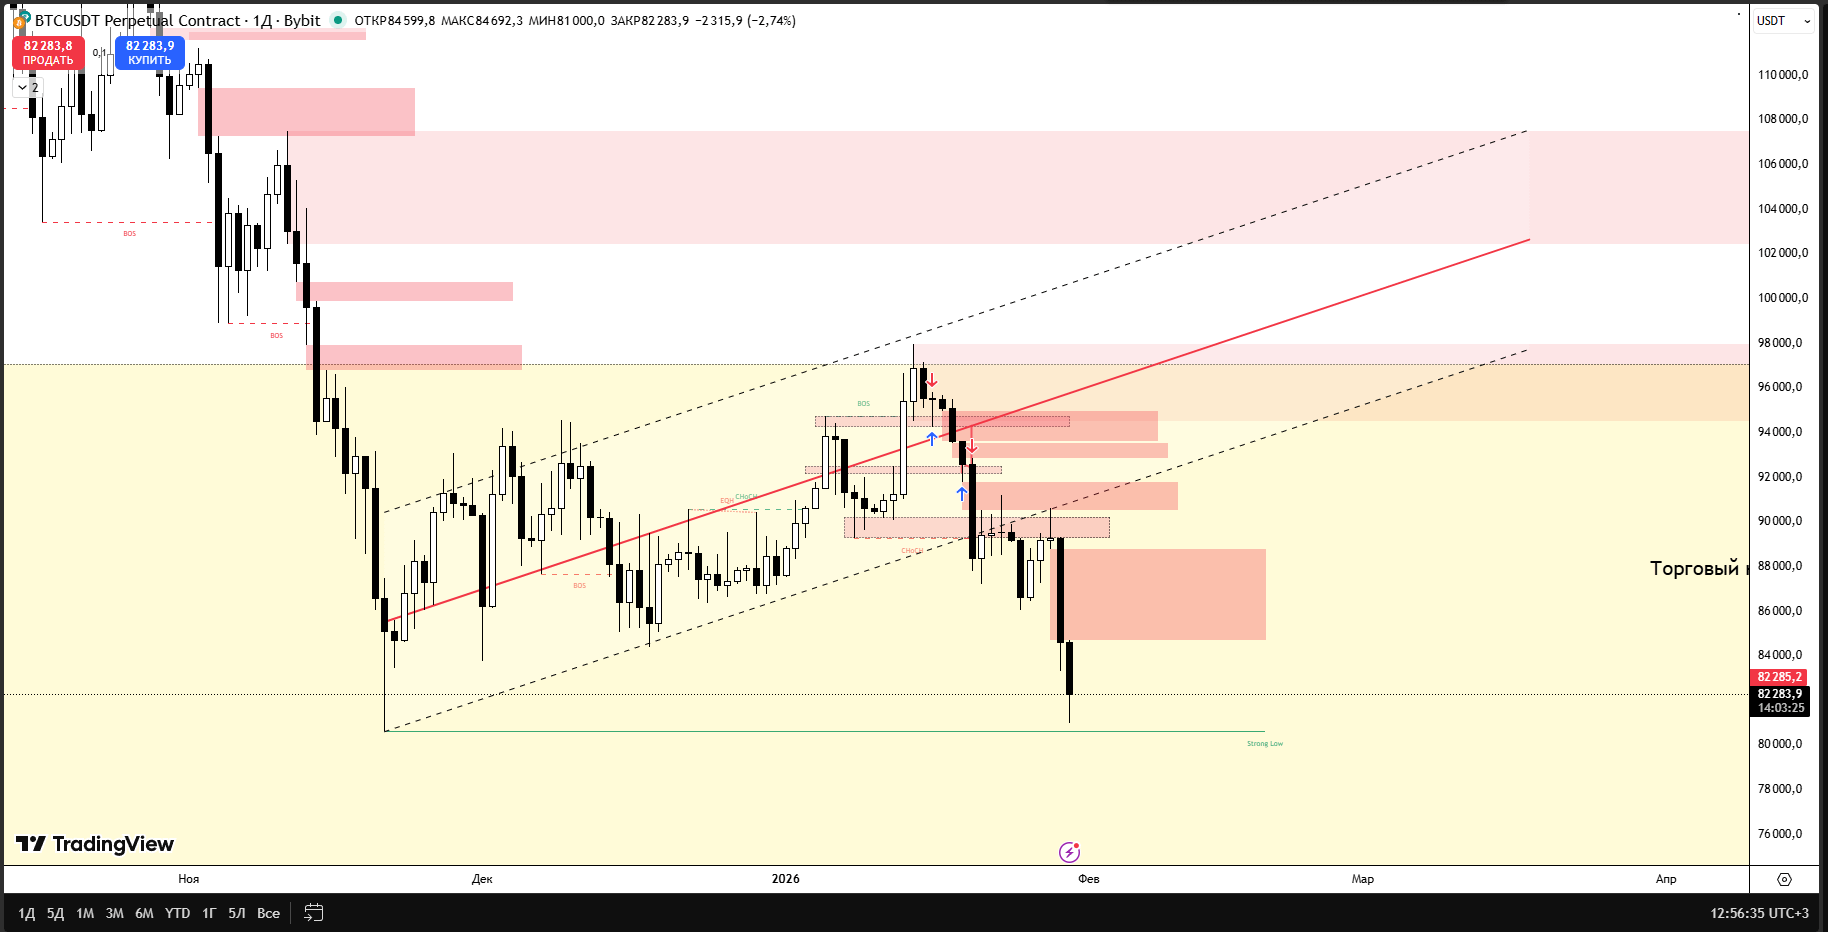
I have marked a trading corridor on my chart. I think we are stuck in it for a long time, and trading will occur within these boundaries. After that, we will go down to the block of orders that I marked in red.
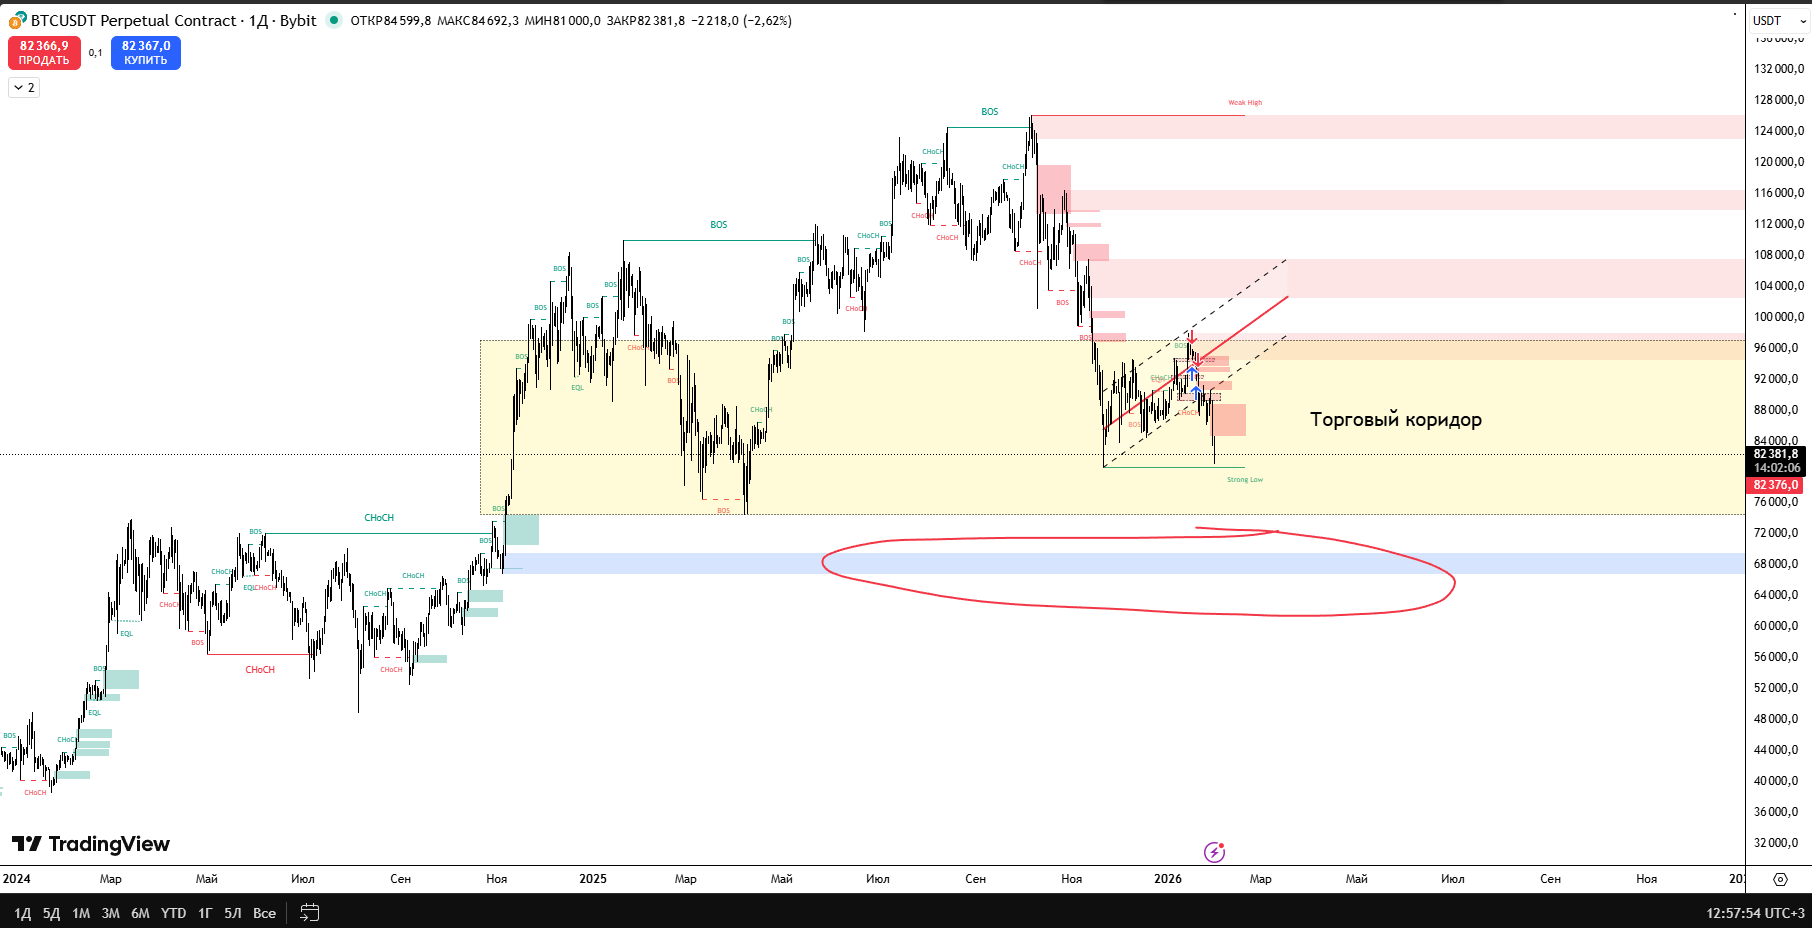
Why I believe it will be exactly like this: this order block is in the price zone where BTC should drop to start a new, large growth cycle. I have already written about my strategy. Critics will naturally say it won't happen, but later they will be typing on their keyboards saying that the "rocket" flew away without them.
There is always a probability of a different outcome, and I do not deny that. However, such a situation has already been confirmed several times in practice. Investing and trading is a "probability check," so this time, this probability needs to be checked as well.
I buy Bitcoin in small amounts constantly, but when the price drops below the lower boundary of the trading corridor, I will do it even more actively! I am not urging anyone to do anything — the risks to your own capital are yours to bear. I am merely sharing my opinion.
$BTC
#btc70k #BTC