
Bitcoin (BTC) slid below $76,000 on Saturday. A series of liquidation waves hit the derivatives market, revealing weak liquidity, and pushed the reported average buying price of **Strategy Inc.**'s Bitcoin holdings down.
The collapse brought on by the liquidation waves
According to data from CoinGlass, the total cryptocurrency liquidation volume over the past 24 hours reached $2.52 billion, with approximately $2.4 billion coming from long positions and $11,608,000 from forced liquidations of short positions.
During the same period, a total of 408,294 traders were liquidated.
The single highest forced liquidation occurred at Hyperliquid (HYPE), where a $222.65 million ETH-USD position evaporated, illustrating how much leverage had built up across the market.
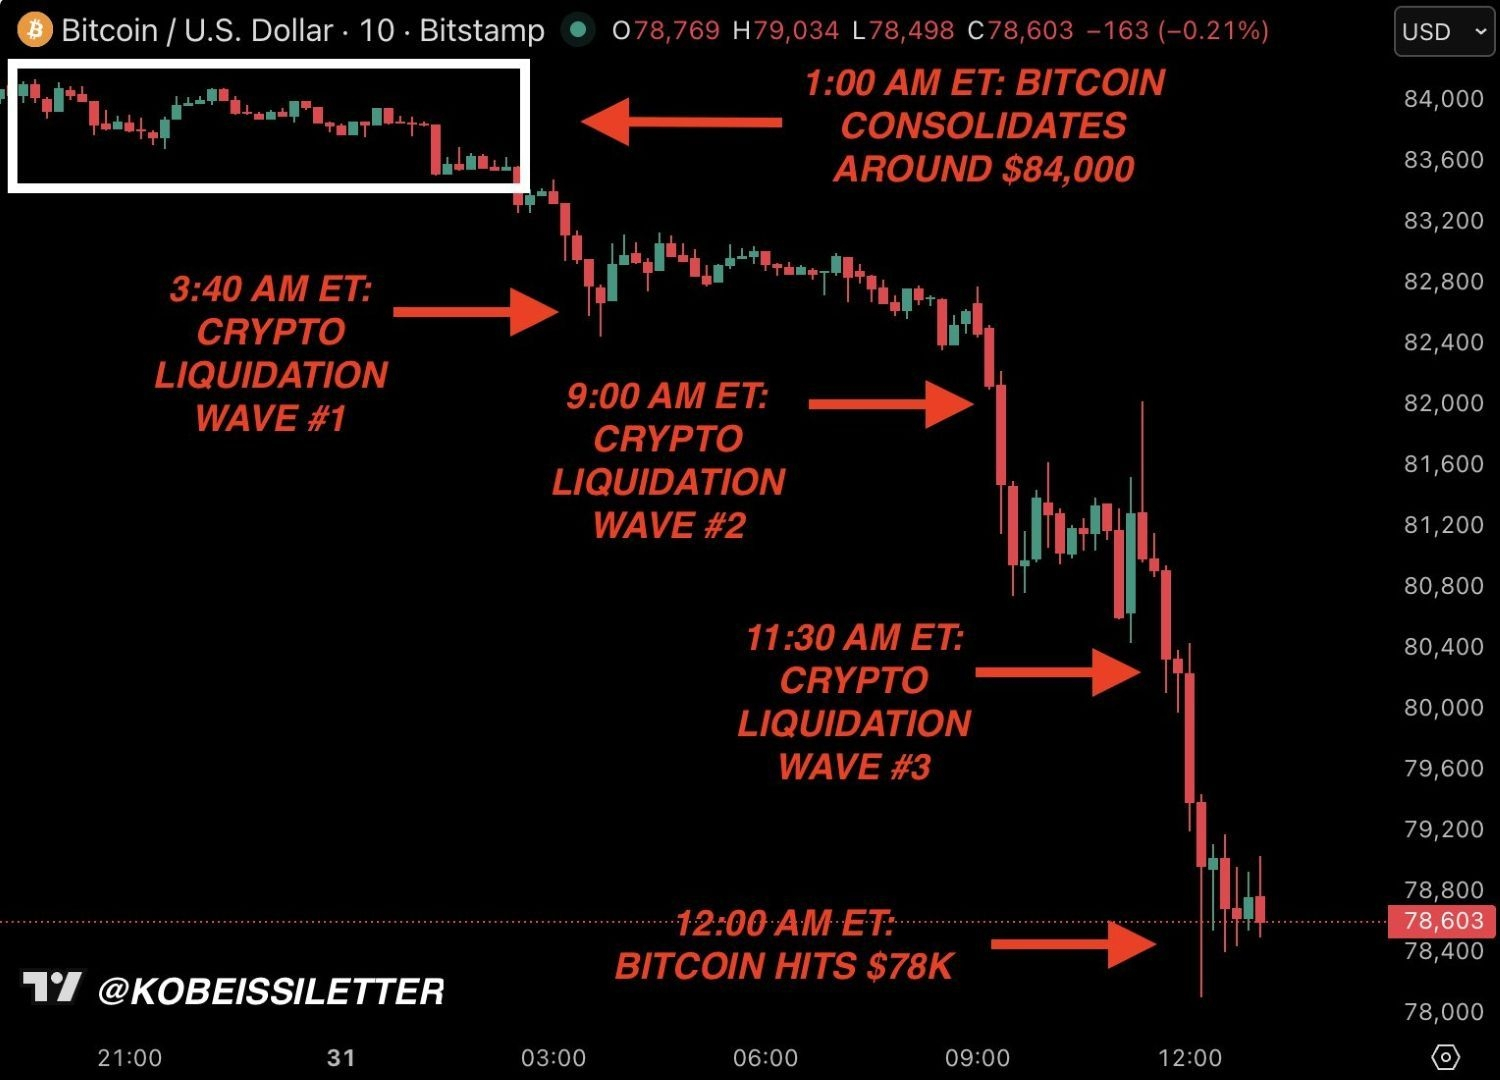
One analysis suggests that the price movement unfolded not as a single continuous sell-off but as several distinctly separate waves of liquidation.
The first wave began as Bitcoin retraced around the $80,000 resistance, triggering margin calls on leveraged long positions clustered in the support zone.
The second wave accelerated as the price slipped into the thin liquidity zone around $78,000, and the third wave occurred as stop orders and forced liquidations clustered below $76,000 triggered simultaneously.
Each wave amplified the next as buy orders dropped off, creating short price gaps instead of orderly repricing.
Thin liquidity creates a feedback loop for leverage
Market observers found the main cause of this movement not in new information but in the market structure.
Related article: “You Are Full Of S—”: Jamie Dimon Confronts Coinbase CEO In Davos As Crypto-Bank Tensions Spill Into Open
Analysts tracking the flow pointed out that with high leverage maintained in a volatile environment, Bitcoin became vulnerable to a chain of liquidations if major technical support levels were breached.
In such an environment, forced selling becomes a self-reinforcing structure, creating a vicious cycle that leads to additional liquidations as market orders convert.
Similar dynamics have repeatedly appeared in recent risk-off markets, demonstrating how mechanically the price discovery process of cryptocurrencies operates when derivatives positioning outweighs spot demand.
If the support line is breached even slightly, a rapid expansion of the decline can occur if leverage is concentrated in one direction.
The acquisition cost of Strategy is drawing attention
This sell-off holds particularly significant meaning for the largest publicly listed Bitcoin holder, **Strategy Inc.** According to company disclosures and treasury tracking data, Strategy has purchased approximately 712,647 BTC for around $54.19 billion, implying an average acquisition cost of about $76,037 per Bitcoin. Recent disclosures indicate that the company continued to buy Bitcoin even at higher price levels, including the $90,000 range in January.
Currently, as Bitcoin prices fall below this average acquisition cost, Strategy's Bitcoin treasury assets have entered an unrealized loss zone based on market valuation. This is in stark contrast to the previous quarter, which recorded significant mark-to-market gains due to price increases.
As Strategy has been simultaneously issuing stock and raising debt to accumulate Bitcoin, the company's exposure has become a key indicator of institutional investor confidence in Bitcoin's long-term trajectory.
Next reading: Can An AI Agent Actually Sue You? Moltbook's Autonomous Agents Are Testing Legal Boundaries