
The current Bitcoin market is best described as a weakly bearish, range-bound adjustment phase rather than a clear bull or a capitulation-driven bear market. Downside pressure remains dominant, but its nature differs from the sharp collapses seen in past cycles.
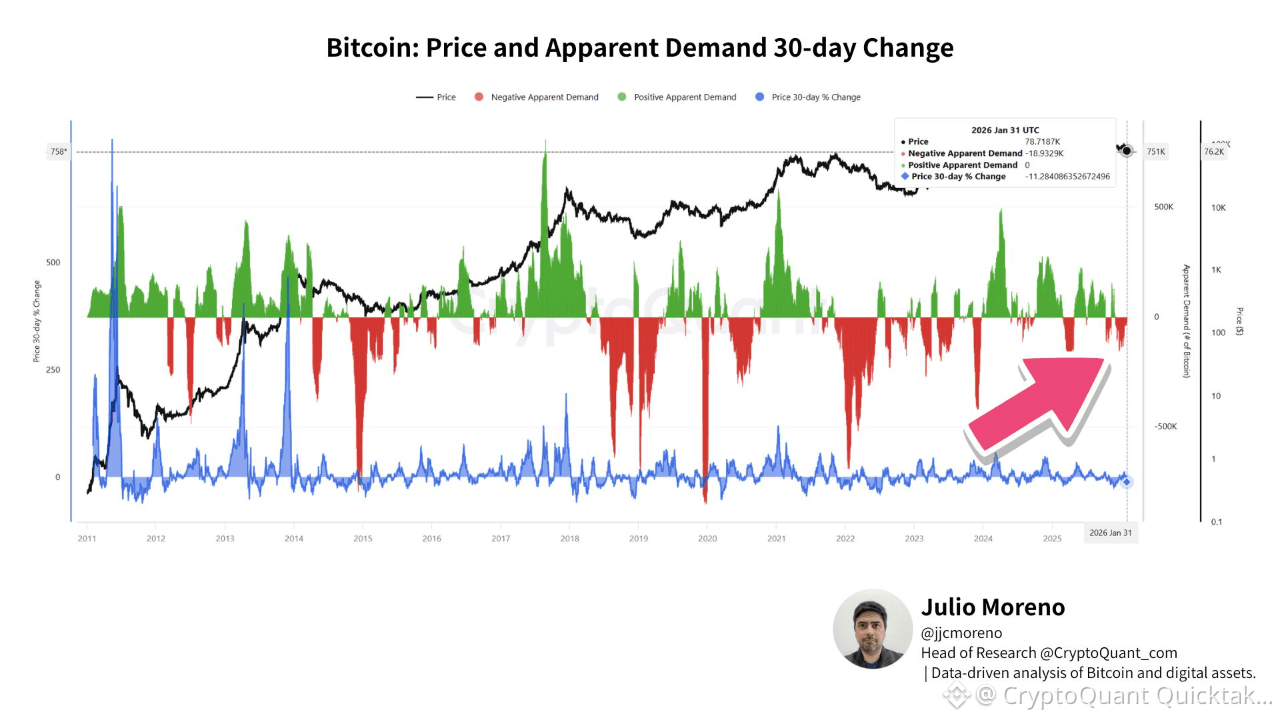
This assessment is supported by the CryptoQuant metric “Price and Apparent Demand 30-day Change,” which measures the net balance between demand and supply in BTC terms. As of late January 2026, Apparent Demand remains firmly negative, around minus 19,000 BTC, while positive demand is largely absent. This indicates that supply continues to outweigh demand, with little evidence of fresh capital entering the market.
This behavior aligns with the flat trend in Realized Cap. When Realized Cap stagnates, it suggests that new capital is not flowing into the network. In such an environment, a declining market cap does not signal a bull market, even if prices remain relatively elevated near the high-$70,000 range. The result is a structural mismatch between price levels and underlying demand.
Historically, deep bear markets in 2014–2015, 2018–2019, and 2022 showed much deeper and more persistent negative Apparent Demand. The current readings, while clearly negative, are less extreme and occasionally interrupted by brief recoveries, pointing to gradual profit-taking rather than panic-driven liquidation.
ETF inflows and MicroStrategy’s purchases previously absorbed selling pressure and supported prices. However, as those inflows have slowed, ongoing distribution by earlier holders has become more visible in demand metrics. Still, there is limited evidence of mass long-term holder capitulation, suggesting a prolonged consolidation rather than a sharp breakdown.
At this stage, a wide-ranging sideways adjustment remains the base scenario. However, if Apparent Demand turns sustainably positive alongside a clear rise in Realized Cap, this view would need to be reassessed.
Written by XWIN Research Japan