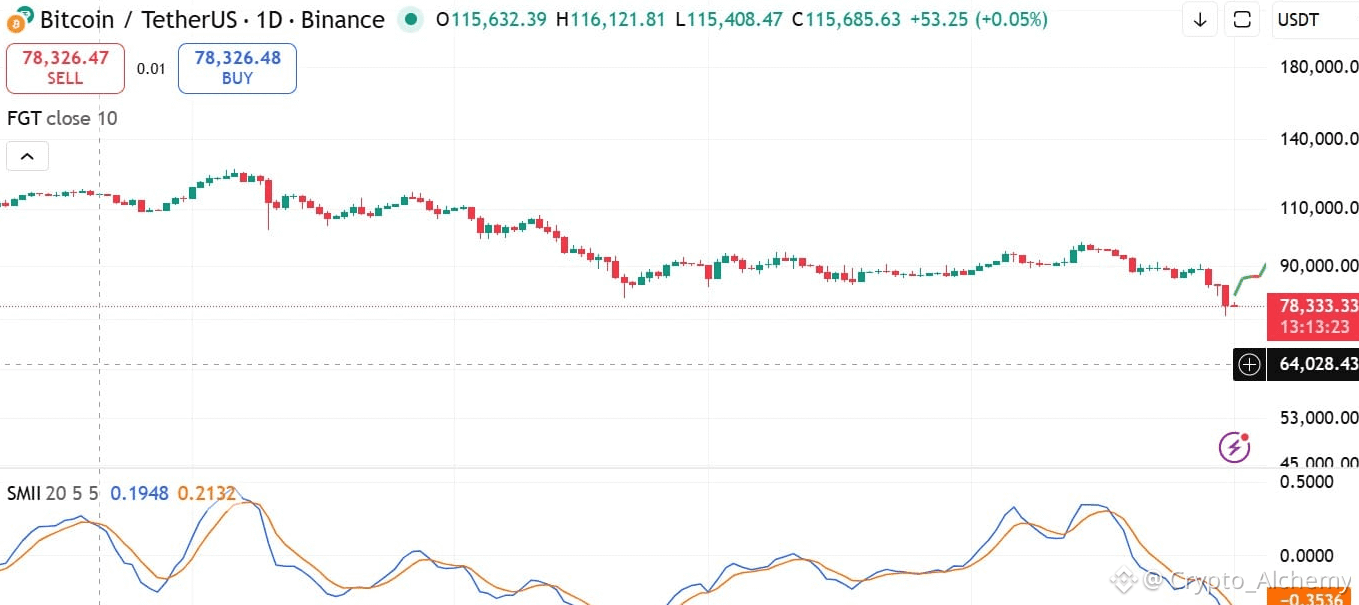
$BTC just took a sharp tumble, dropping to a level we haven't seen since April 2025.
It briefly touched $75,519 before finding a small bounce. Right now, it's hovering around $78,860, down about 4.6% today and 10% over the past week.
This isn't just a small dip it’s part of a prolonged downtrend that’s making investors nervous.
Many traders have stepped back, and others are reducing their exposure. The mood has shifted from excitement to caution.
Where Did All the Money Go?
One of the clearest signs of trouble is that fresh money has stopped flowing into Bitcoin.
According to on-chain analyst Ki Young Ju, the Realized Cap—which tracks the real capital invested has flatlined. This means no new significant money has entered the market recently.
For months, two big forces were propping up Bitcoin's price:
MicroStrategy (now just called "Strategy") kept buying relentlessly, adding over 500,000 BTC between 2024 and 2026.
That pumped over $50 billion into Bitcoin without any selling from them.
Spot Bitcoin ETFs brought in a flood of institutional cash, with total assets soaring past $100 billion.
But now, that institutional demand has dried up. The ETFs have seen net outflows for most of the past ten days, including a notable $1.3 billion leaving in just two days at the end of January.
When the big players stop buying, the market feels it.
The Selling Pressure Is Real
While the buying has stopped, the selling hasn’t. Here’s where the pressure is coming from:
ETF Outflows: As mentioned, institutions are pulling money out.
Exchange Inflows: Over the last three days, a significant amount of Bitcoin has been moved onto exchanges over 87,000 BTC.
This is usually a sign holders are preparing to sell. At one point, net inflows hit 9,500 BTC in a single day, a clear signal of "spot dumping."
This selling triggered a cascade of liquidations. In the derivatives market, over $736 million in long positions were forcefully closed recently.
This forced selling accelerates the downtrend and panics other holders into exiting.
So, Is the Bottom In?
The technical picture looks tough. Key momentum indicators have turned deeply bearish, suggesting sellers are in full control and buyers have stepped aside.
This sets Bitcoin up for more potential downside.
Key level to watch: $76,000. If this support breaks, we could see further declines.
However, if Bitcoin can firmly hold above $76,000 and buying pressure returns, there is a path for a relief rally.
In a more optimistic February scenario, we could see a bounce back toward the $85,000 to $92,000 range before encountering resistance again.
Bitcoin is at a critical juncture.
The institutional fuel that drove the rally has paused, and selling pressure is dominating.
The next move depends on whether $76,000 holds as support. If it does, a bounce to $85K is possible.
If it fails, brace for more volatility. Keep an eye on ETF flow data and exchange movements they’ll tell the next part of the story.