

Context: 2025 was very tough.
In 2025, most crypto tokens were struggling and many individuals can testify to it. It was an unhelpful year, marked by an experimental Strategic Bitcoin Reserve, the inauguration of an American president, and wide swings in the economy. The gains, Pantera capital said, were primarily market moves and money flow and not projects. At the end of the year, Bitcoin fell approximately 6 per cent, Ethereum about 11 per cent and Solana approximately 34 per cent. The entire token market had dropped nearly 60 percent and the average token had dropped approximately 79 percent.
One can easily say that hype faded away in simple language. Bad stories were gone. All that remained were basic concepts: Bitcoin is digital gold, and Ethereum is a payment tool. I observed numerous meme tokens become interested and vanish in no time. Initially it was sad, but also demonstrated that, in the absence of the noise, the actual trend is more obvious.
The first chart below depicts that gap.
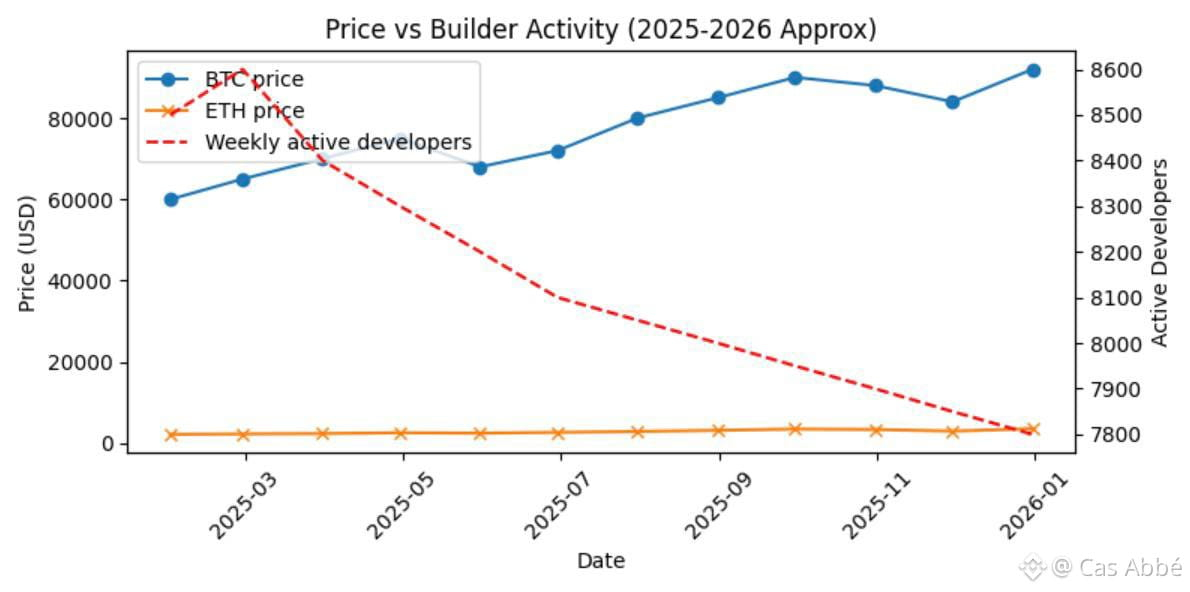
Price vs builders. The graph represents the prices of Bitcoin and Ethereum on the right and the number of developers who write codes every week on the left. Although the price in 2025 dropped significantly, there was a similar number of code commits. It is a lesson that in times of falling markets real builders do not stop.
Builders continue to build - what the statistics indicate
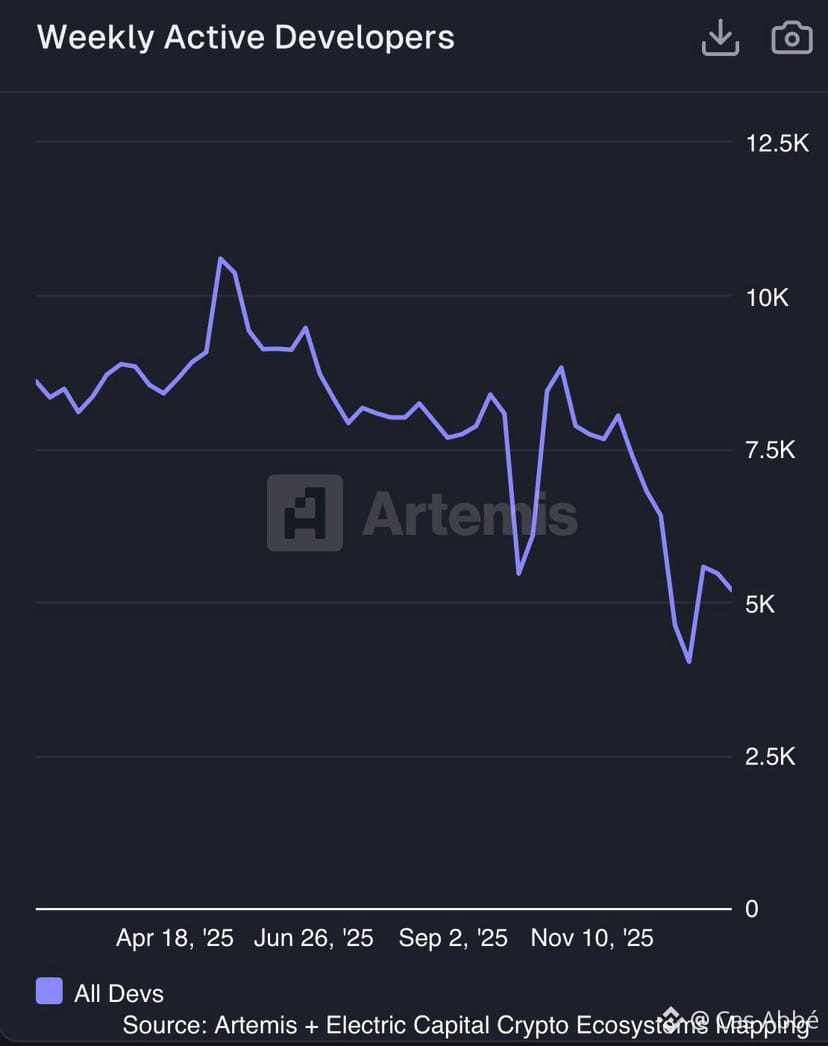
One of the greatest lessons of the previous crypto bear markets is that developers remain long term. This continues to be reflected in the data of Electric Capital.
The developers commited 902 million code commits in 1.7 million repositories in 2024. Although the number of developers in general decreased by approximately 7 percent, experienced ones (two years or older of experience) increased by 27 percent and completed 70 percent of all commits. One-third of them also was employed on several blockchains.
We saw the same in 2023. Total commits were 485 million. The total number of developers decreased by 24 percent, the number of experienced developers increased 52 percent per year, and approximately 30 percent of all developers had to work on more than one chain. The 2018, 2022, and 6-month moving averages data indicate that developers continued to code as prices decreased. As of 2021, over 18 000 active developers monthly, as well as 34 000 new developers were added, which was among the largest amounts in history.
Other data support this. According to CoinLaw (2026), in 2024 there were approximately 23,615 developers in crypto; by 2023 there were 25,419 developers and in 2026 there were 39,148 developers. Ether received approximately 16,181 new developers, and Solana received approximately 11,534. By 2025, the networks that we were following had approximately 66,000 developers altogether.
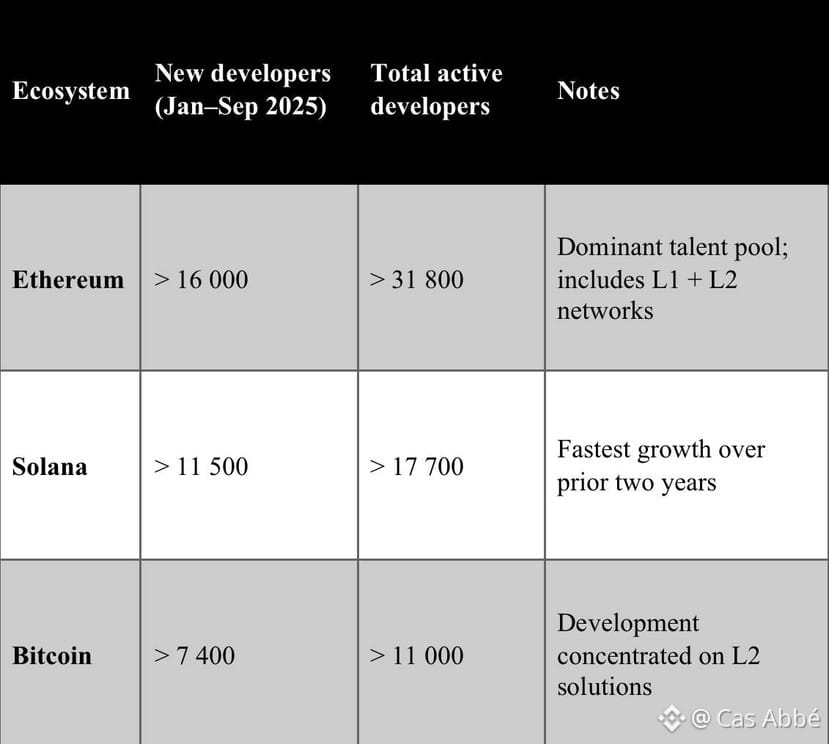
To emphasize this, below chart tell you most optimal estimates of developers in each ecosystem.
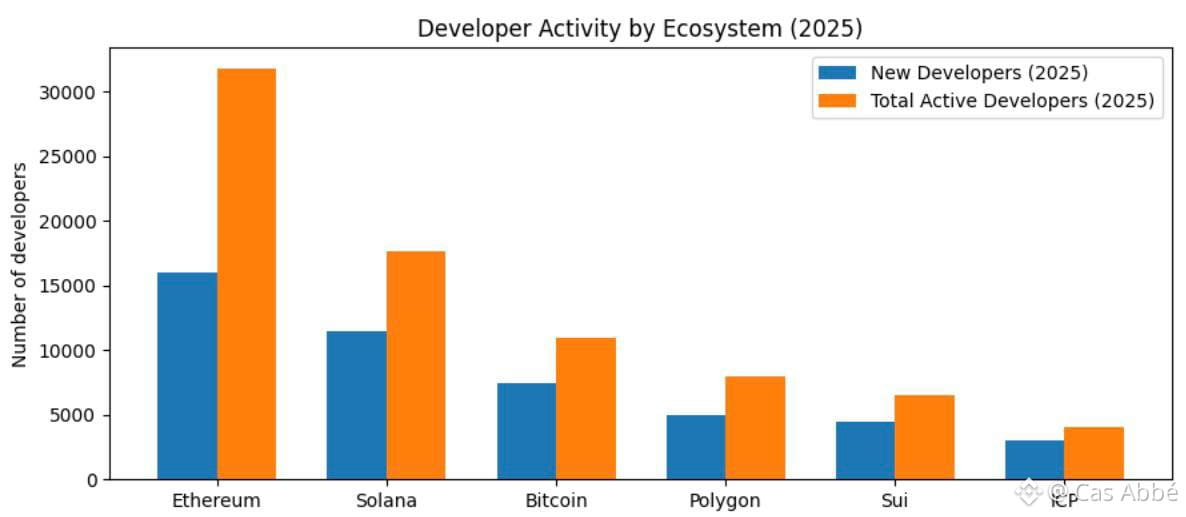
Ecosystems of developers. The number of new developers added to Ethereum was approximately 16,200, and it retained 31,800 active developers. Solana had approximately 11,500 new developers and retained approximately 17,700 active ones. Bitcoin gained approximately 7400 new developers and retained approximately 11000 active ones. Polkadot has good developer communities and so does Cosmos. The obvious message: in spite of low prices, serious developers are drawn into the major networks.
Reduction in supply- why ETH is tightening.
The half of the story is to be told by price changes. The other half is the amount of supply which is interesting to Ethereum.
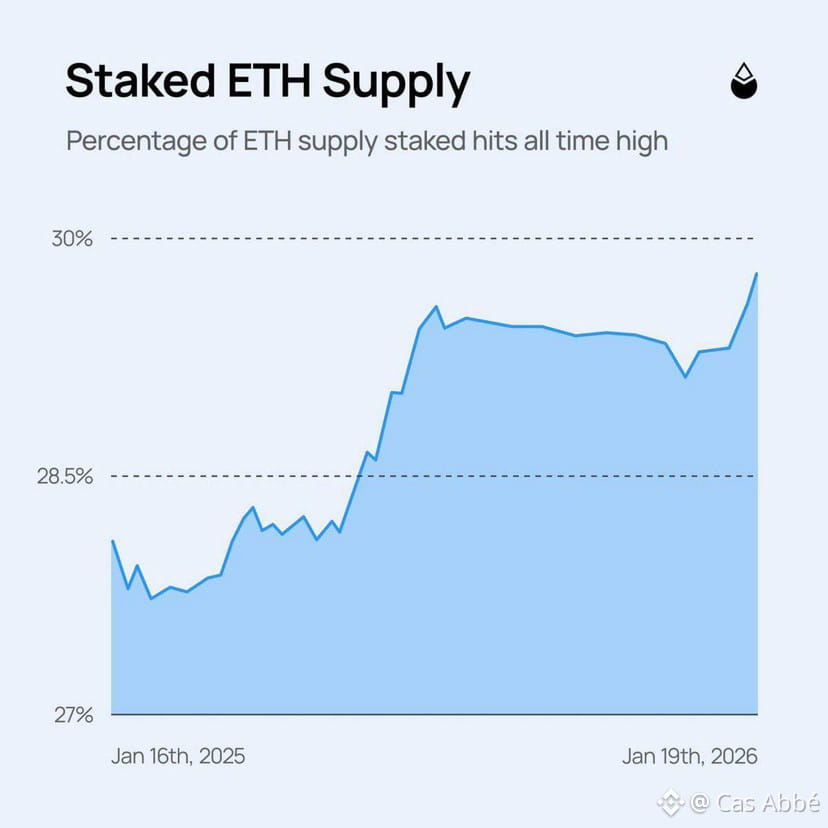
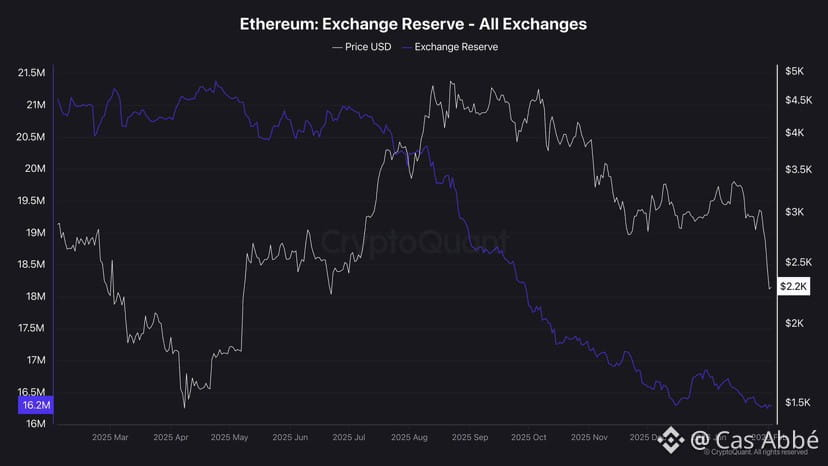
According to the Q1 2026 prospects of Sygnum, 45 percent of all ETH is locked or untradeable. The exchange balances decreased 14.5% during that quarter and continued to decrease. The exchange-traded funds are owned by about 10 percent of all ETF funds and over 6.1 million ETFs or approximately 5 percent of it is owned by the public companies.
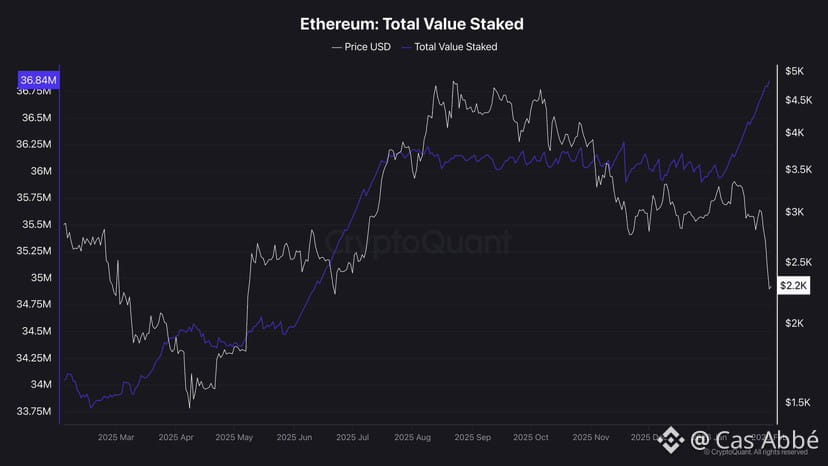
Even more impressive is the fact that the network is busy. Ethereium recorded approximately 145 million transactions, 8.7 million smart contracts and nearly eight trillion dollars stable-coin transfers in the same quarter. The ETH is tight due to high usage and low liquid supply. Prices can increase when the demand increases due to the lack of ETH to trade.
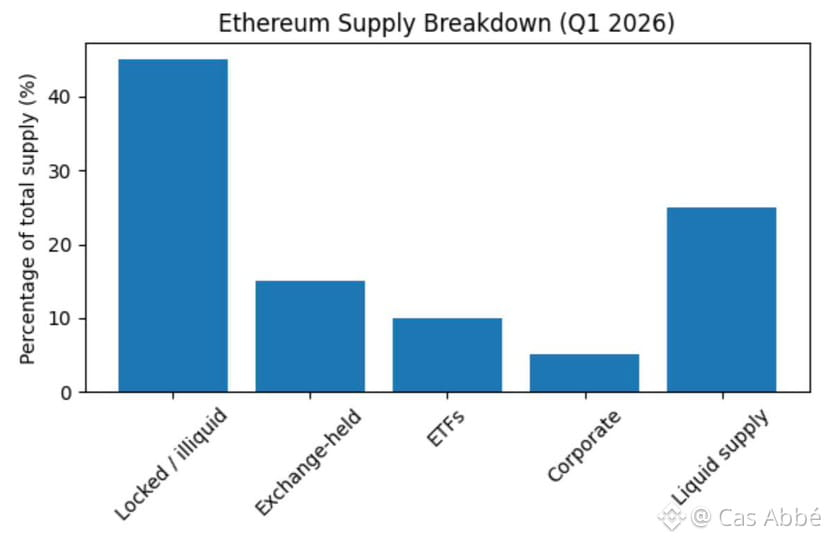
Ethereum supply distribution.
Approximately 45 per cent of ETH is in staking, contracts or bridges. Exchanges keep about 15%. ETFs hold around 10%. Corporate treasuries retain approximately 5 percent. It is a liquid of ETH only to the extent of 25% of ETH. The trading size of ETFs and corporate holdings continues to reduce as the quantity of ETH you can trade declines.
According to Trakx, there are over 26 companies who own over 5.7m ETH in total, approximately 4.7% of all ETH, in that year. Another piece of information that they discovered is that governments and businesses possess about 8 percent of Bitcoin. It is actual now: digital asset treasuries are extracting coins off the market and putting them in the long-term lock up.
Macro performance and crypto.
It is not very difficult to consider crypto itself but you can also consider how it compares to other markets. One of the charts illustrates the performance of Bitcoin, Ethereum, S&P 500 and gold over the past one year. Stocks and gold dropped as well as crypto was volatile. That is natural with new technologies which are being re-priced during major economic shifts.
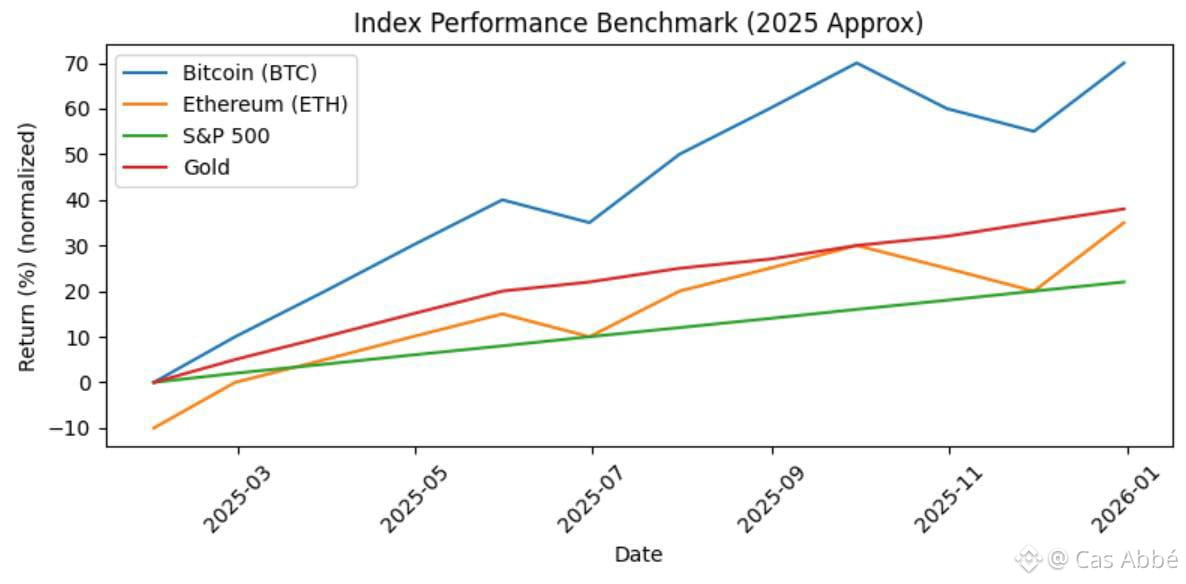
Performance of macro index
Although this year saw significant declines, Bitcoin and Ethereum outperformed the traditional assets over a few months. Market cycles refer to the extent of the risk that people are ready to take rather than an indication of the failure of the technology.
Why constructors survive markets
Upon viewing the data, there are some distinct facts. Cryptocurrency bets wipe quickly, and decent fundamentals remain. In 2025, not many assets retained their value and the majority of tokens dropped by 60 percent or more. The tokens that had no actual users or money vanished, and the infrastructure of the parts of the network that settle transactions remained active. In a research carried out by Tiger, he states that the only projects that have a high likelihood of surviving to 2026 are those that have real revenue and real users.
The best indication of long-term health is the developers. Experienced developer groups increased even when prices went down. They collaborated both between chains, and new constructors continued to enter the largest ecosystems. It is not the hope of a price increase that will lead builders to continue working on a project, but to demonstrate belief in it.
Meanwhile, supply which is being locked up is increasing. Having nearly half of ETH locked, an increase in demand can significantly impact the corporate treasuries, which are increasing. Bitcoin also is beginning to act as a reserve asset as governments and institutions continue to add to their reserves.
Lastly, the market is being redefined by big institutions. Firms, governments and investment managers are introducing blockchain applications, token schemes and regulated investments. The ETFs of digital assets and corporate treasuries generate long-term demand which previously was not there.
Conclusion:
I always believed that hard markets go away but constructors remain. In the 2025-26 downturn, I observed teams continuing to perform, founders reducing expenses and remaining determined, and institutions quietly acquisition of infrastructure assets. The data back that. The number of core developer groups increased even in falling prices. There was a reduction in the supply of liquid due to the staking of coins by ETFs and corporate vaults. Businesses and governments establish official digital treasuries of assets. In the meantime, short-term traders went away and the market became quieter.
When the next expansion phase begins, it won’t reward those who chased fleeting narratives. Do not pay attention to the hype as an investor. Find teams that have living products, living users and working developers. Markets fluctuate and come and go, and builders and networks they construct continue to exist.