Japanese Candlestick is not just green and red lines on the chart; they are the market's language, reflecting the psychological battle between Buyers (Bull) and Sellers (Bear). Understanding candles gives you the key to interpret price behavior.
Below is a detailed analysis of candlestick groups from basic to complex, helping you build a solid foundation for technical analysis.
Part 1: Basic Structure of Japanese Candlestick
Before diving into the patterns, we need to understand the "atoms" that make them up. A standard candle consists of:
Candle Body: The distance between the opening price and closing price. The longer the candle body, the stronger the buying/selling pressure.
Candle Shadow/Wick: The thin lines above and below the body of the candle.
Upper Shadow: Represents the highest price during the session.
Lower Shadow: Represents the lowest price during the session.
Conventional color scheme:
Green (or White): Bullish candle (Close price > Open price).
Red (or Black): Bearish candle (Close price < Open price).
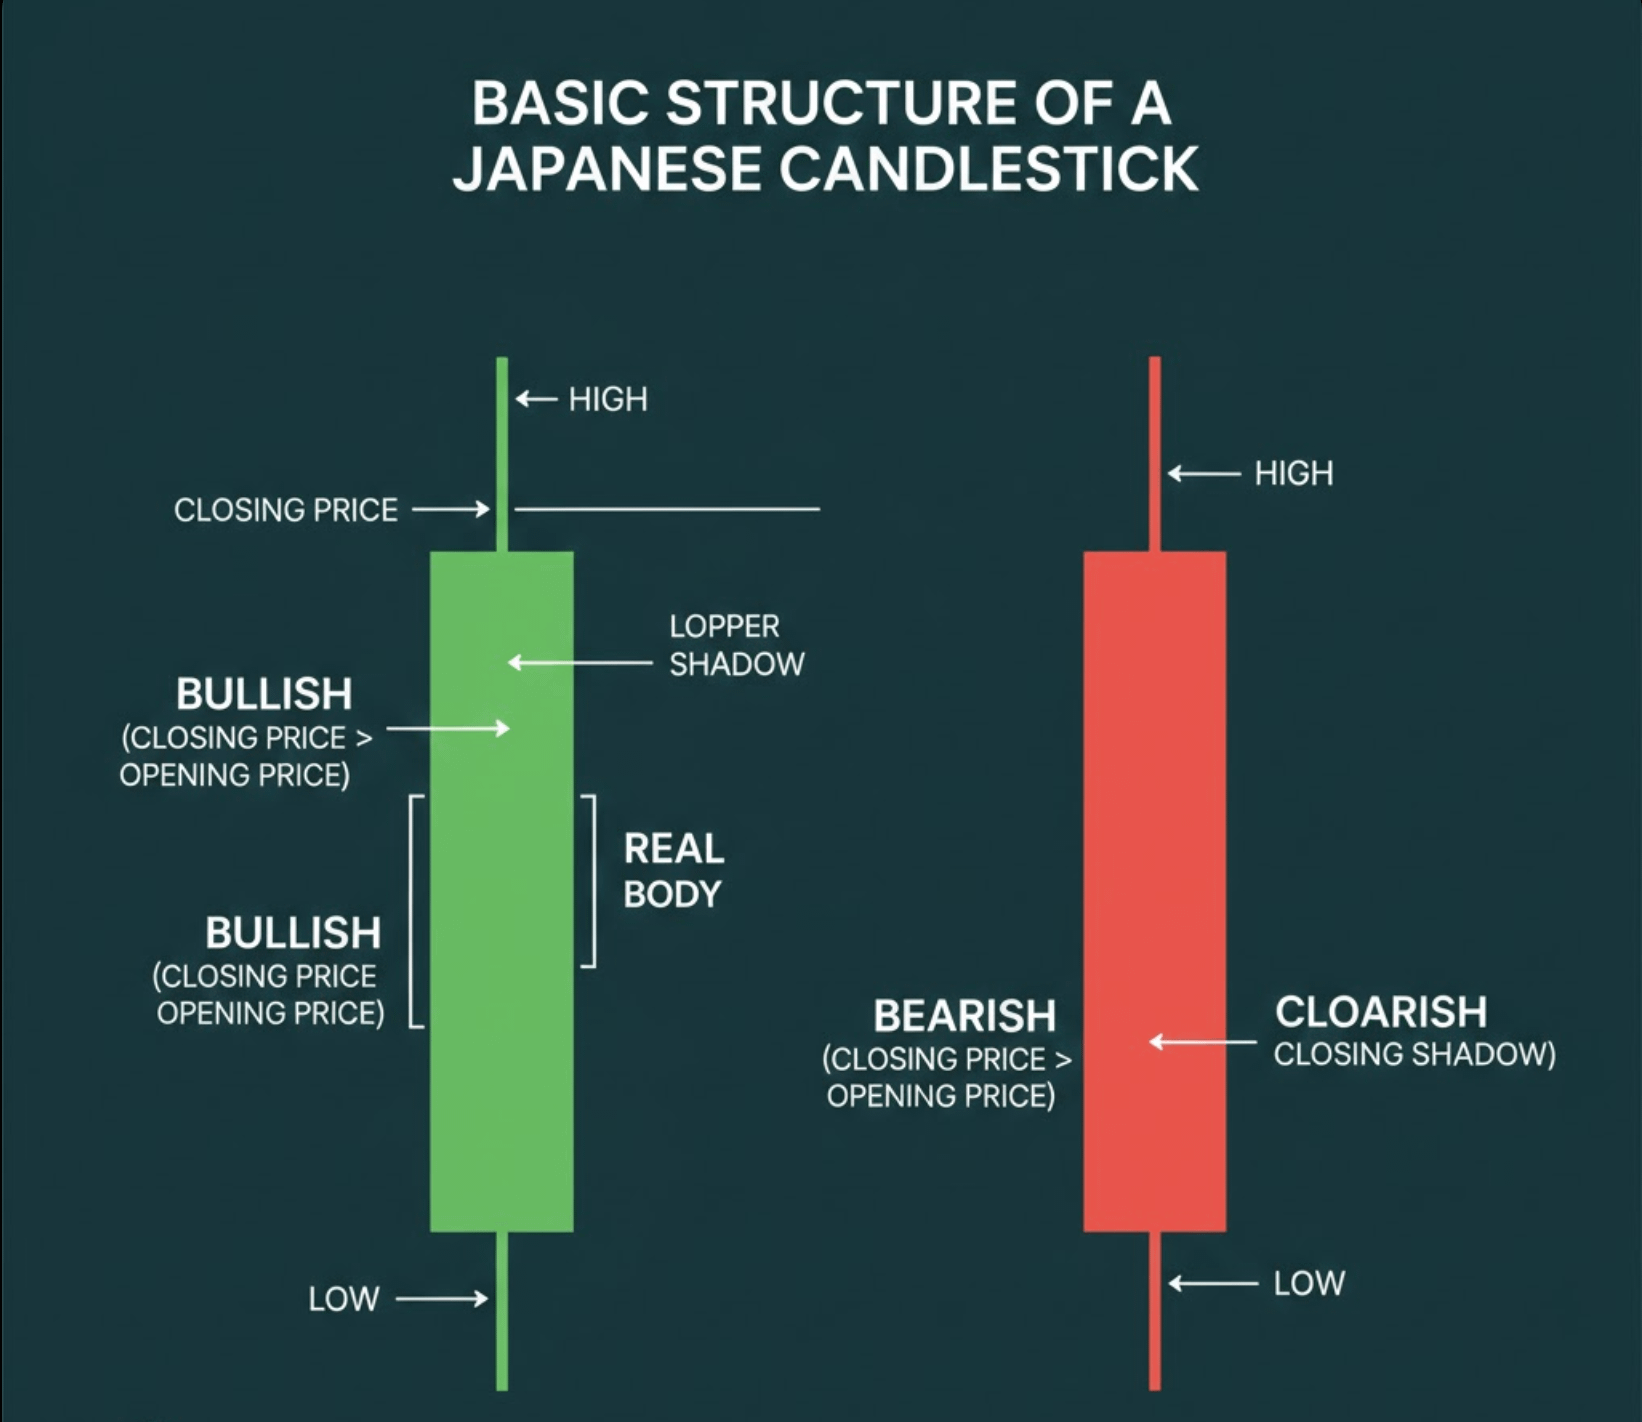
Basic structure of Japanese candlesticks
Part 2: Group of Single Candle Patterns
Single candlestick patterns provide quick signals about shifts in market sentiment at a specific moment.
1. Hammer - Bullish Reversal Signal
Characteristic: Small body at the top, with a lower shadow at least twice the body length, with little or no upper shadow.
Meaning: Appears in a downtrend. It shows that the Sellers tried to push the price lower, but the Buyers strongly entered to push the closing price up near the opening price.
Trading: Wait for the candle to confirm an increase before entering a Buy order.
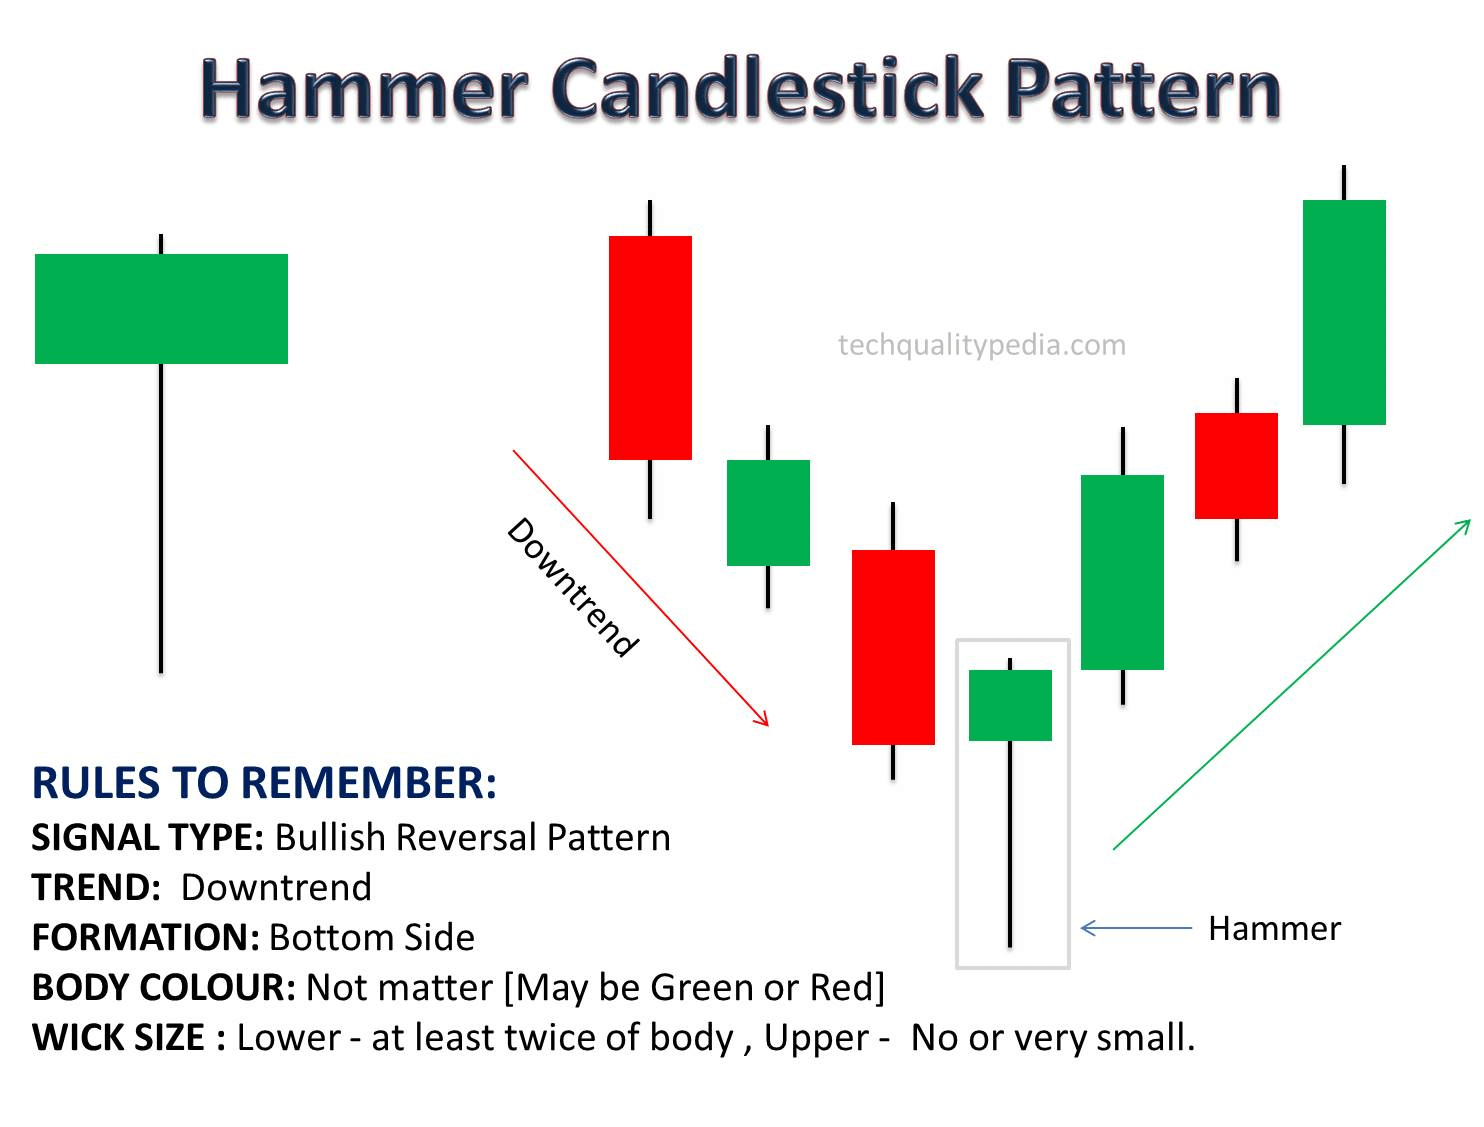
Hammer candle - Bullish reversal signal
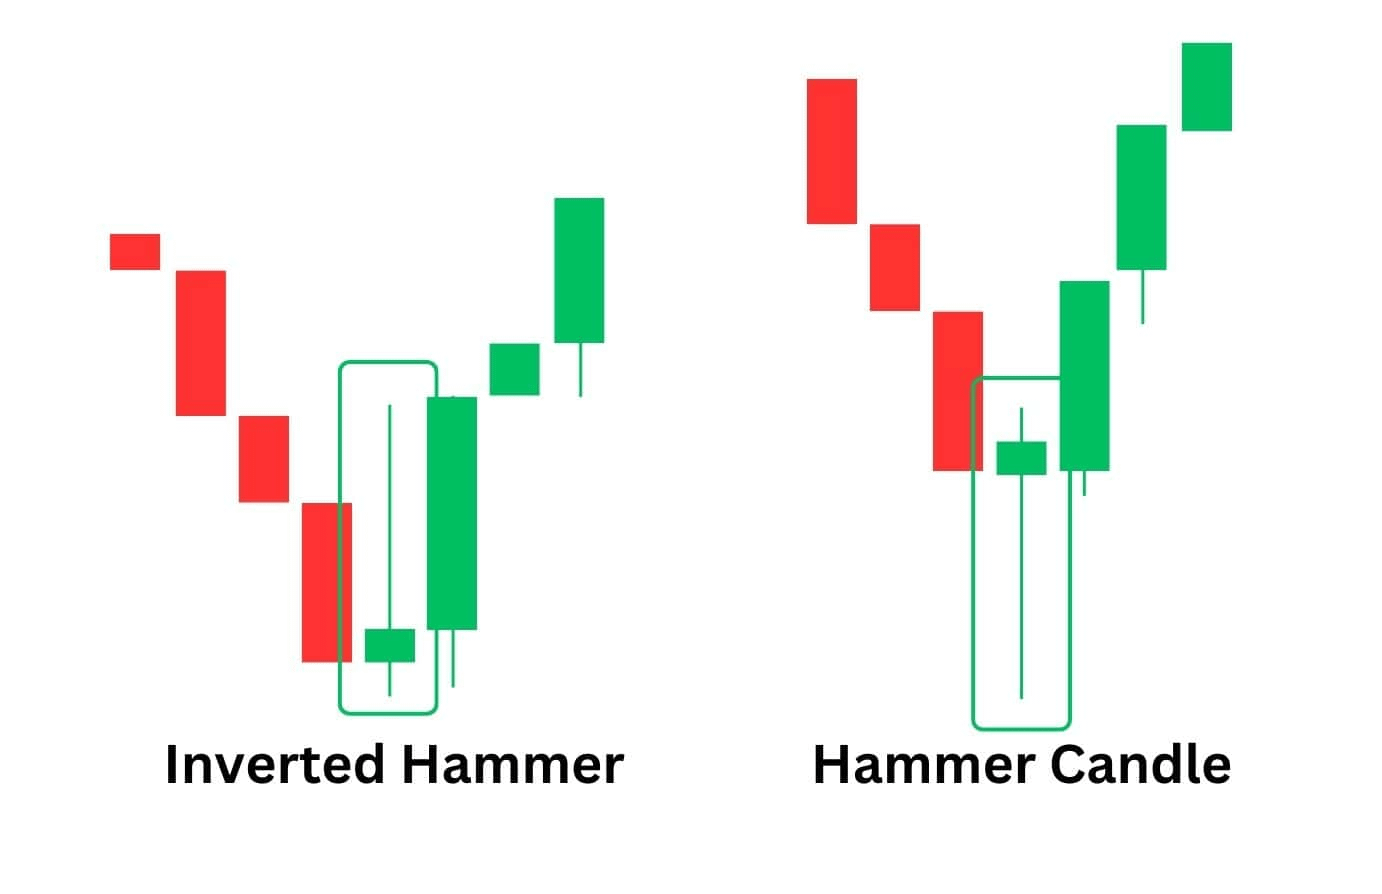
2. Inverted Hammer
Characteristic: Small body at the bottom, long upper shadow.
Meaning: Appears at the bottom of a downtrend. This is a sign that the Buyers are beginning to test higher price levels. Although the price is pushed down again, the downward momentum has weakened.
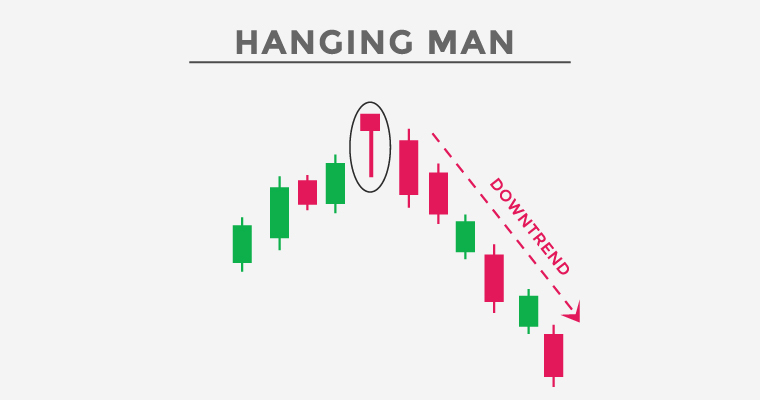
3. Hanging Man - Bearish Reversal Signal
Characteristic: The shape is identical to a Hammer but appears at the top of an uptrend.
Meaning: Indicates that selling pressure is starting to appear intensely. Although the Buyers managed to recover the price, the appearance of a long lower shadow is a warning that the "safe zone" has been breached.
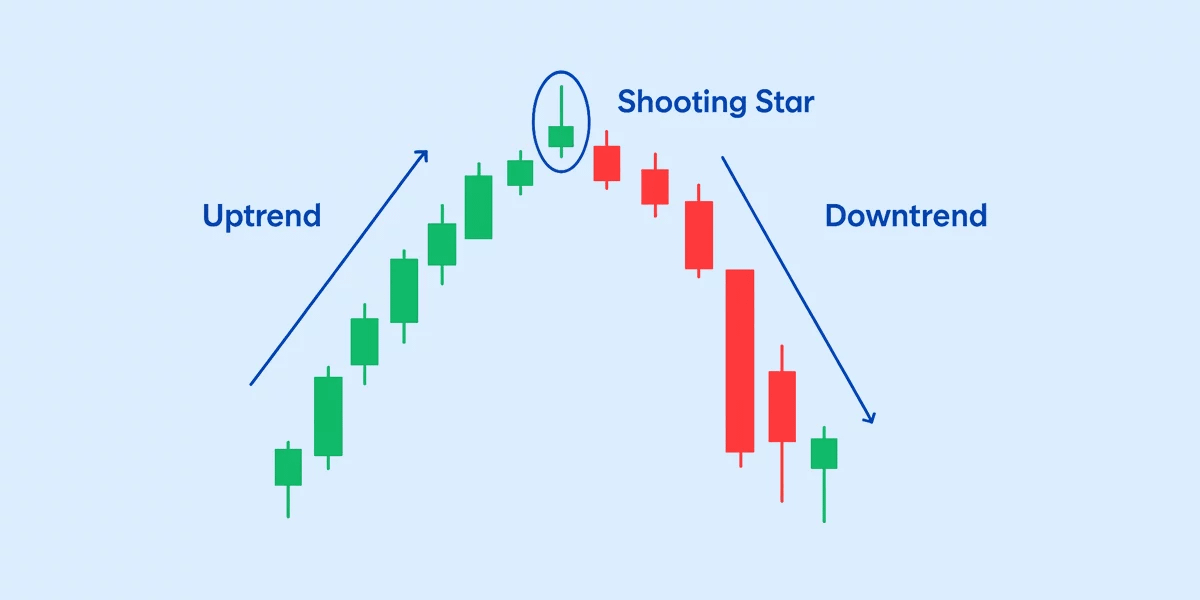
4. Shooting Star
Characteristic: Small body at the bottom, with a very long upper shadow.
Meaning: A bullish trap. Prices push up high but are met with a cold shower from Sellers, forcing the closing price back down to a low level. This is a very strong bearish reversal signal.
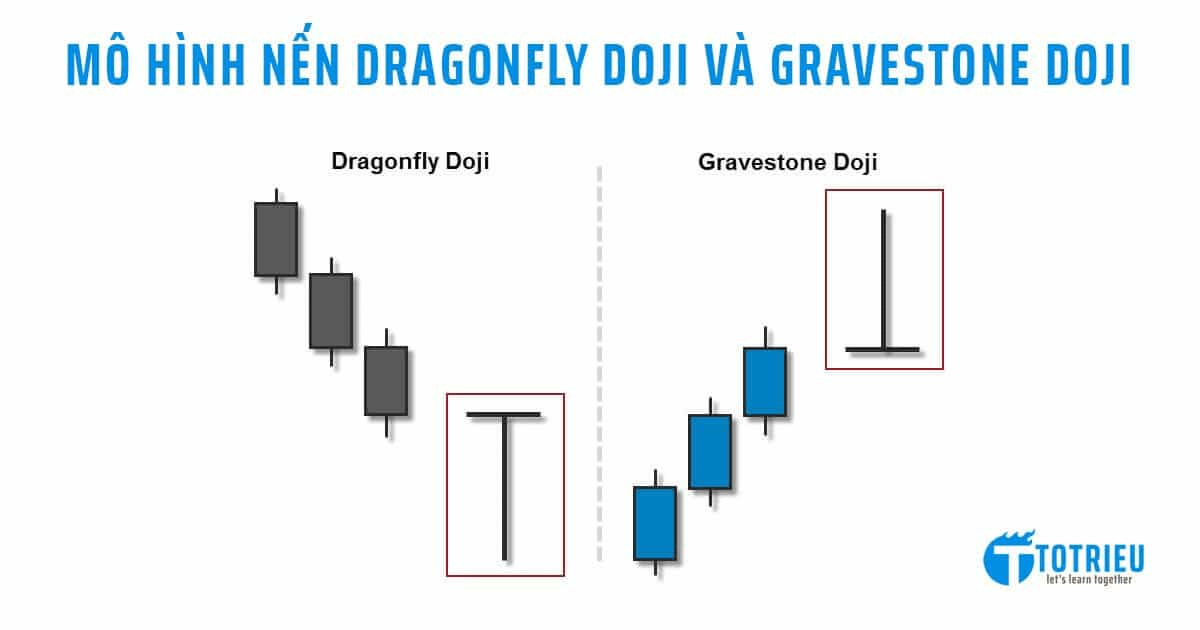
5. Dragonfly Doji & Gravestone Doji
Dragonfly Doji: Open, high, and close prices are nearly equal. Signals a bullish reversal at the bottom.
Gravestone Doji: Open, low, and close prices are equal. Signals a bearish reversal at the top.
Two types of Doji candles
Part 3: Group of Double Candle Patterns
When two candles combine, they tell a story about the transfer of power.
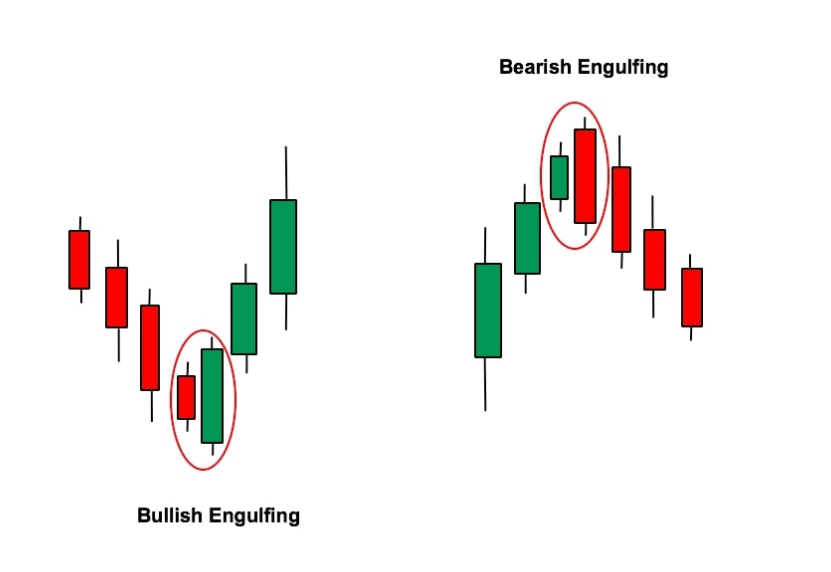
1. Bullish & Bearish Engulfing
Bullish Engulfing: The second candle (green) completely engulfs the first candle (red). Indicates that the Buyers have full control of the game.
Bearish Engulfing: The second candle (red) engulfs the first candle (green). A strong sell signal.
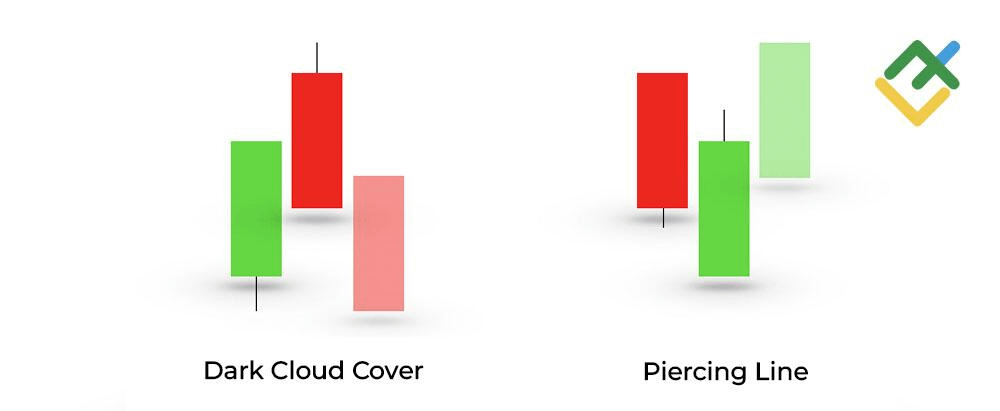
2. Piercing Line & Dark Cloud Cover
Piercing Line: The green candle closes above 50% of the previous red candle's body.
Dark Cloud Cover: The red candle closes below 50% of the previous green candle's body.
Note: These are reliable reversal patterns because they show successful resistance from the opposing side.
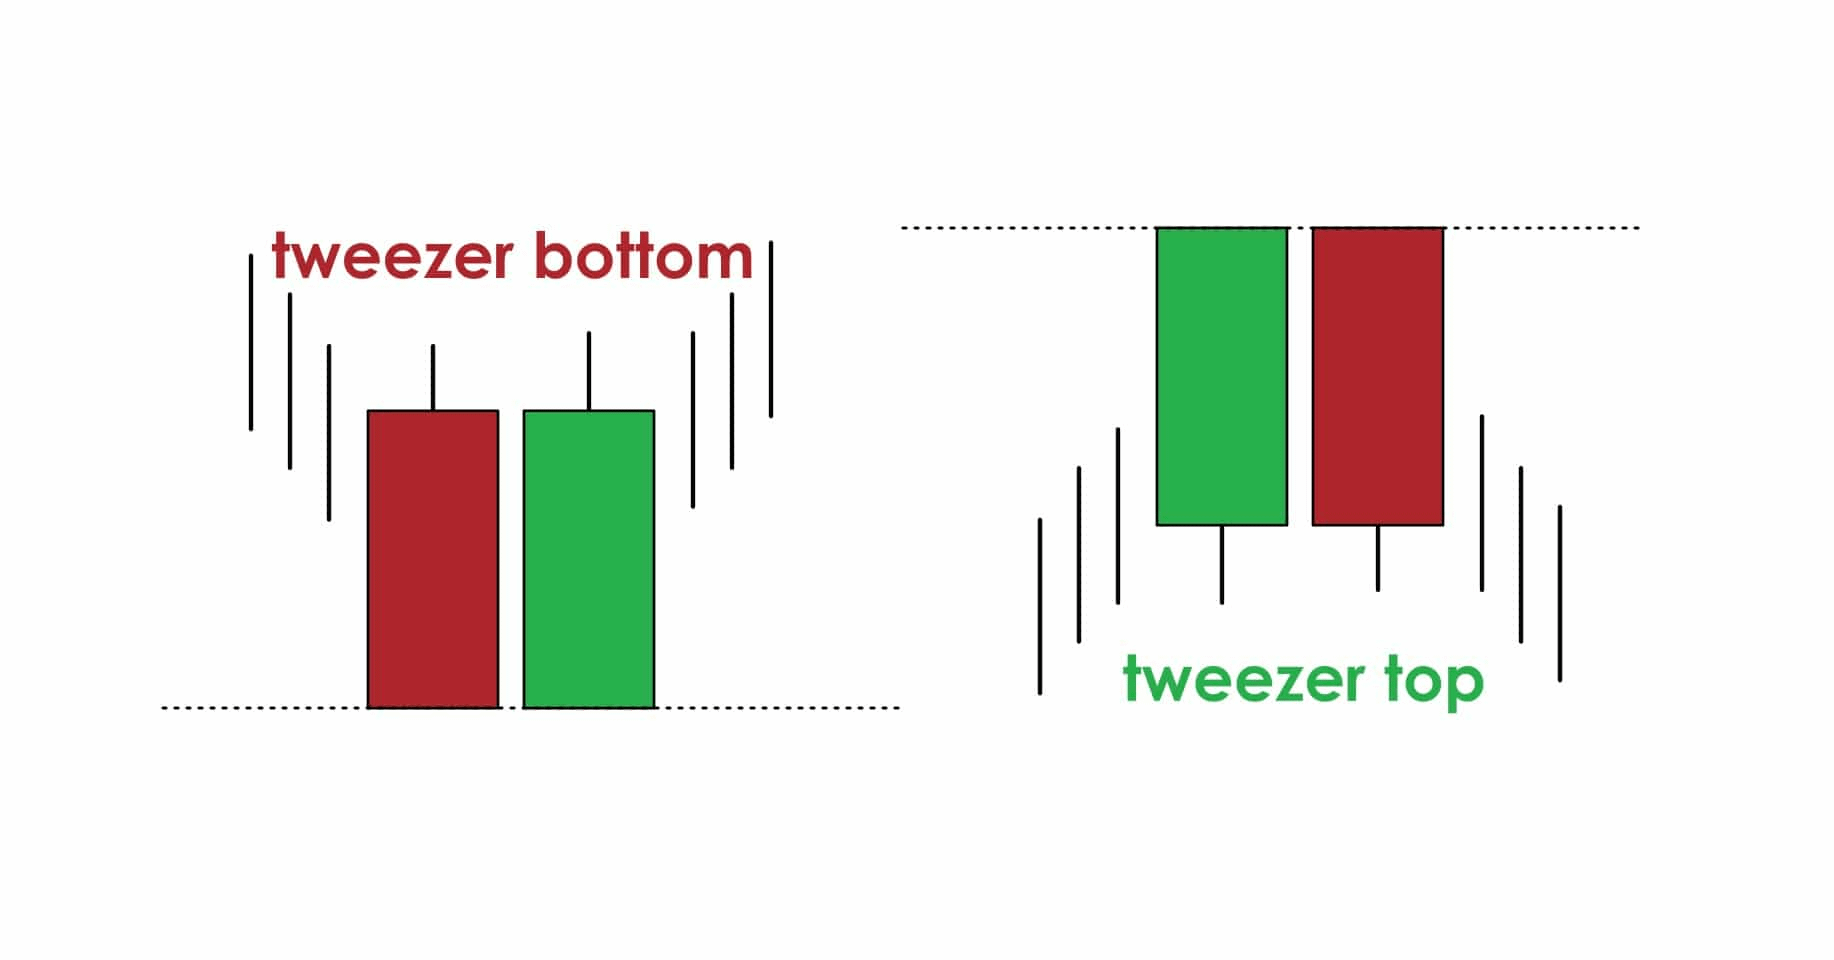
3. Tweezer Bottom & Tweezer Top
Characteristic: Two candles with equal lows (Bottom) or equal highs (Top).
Meaning: Indicates that the market has tested a price level twice and failed to break through, creating a very strong temporary support/resistance level.
Part 4: Group of Complex Patterns (Three+ Candle Patterns)
These are the models with the highest validity because they require a lot of time to form.
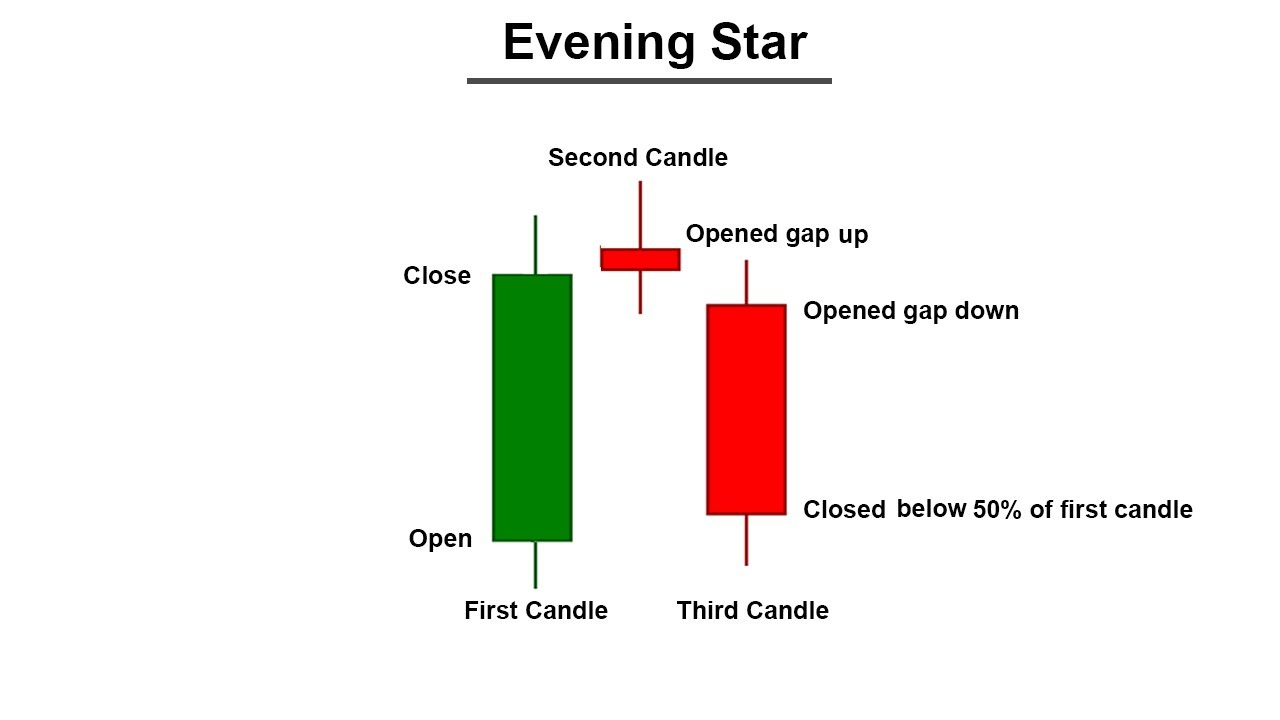
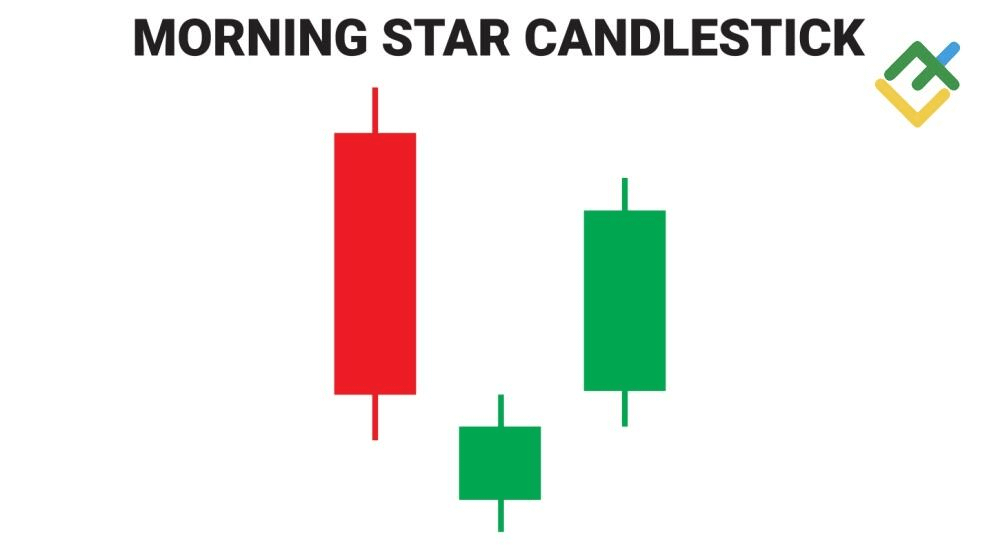
1. Morning Star & Evening Star
Morning Star: Consists of a long bearish candle -> Small body candle (Doji) -> Long bullish candle. Symbolizes dawn, where prices begin to rise again.
Evening Star: Conversely, signals dusk and the beginning of a downtrend.
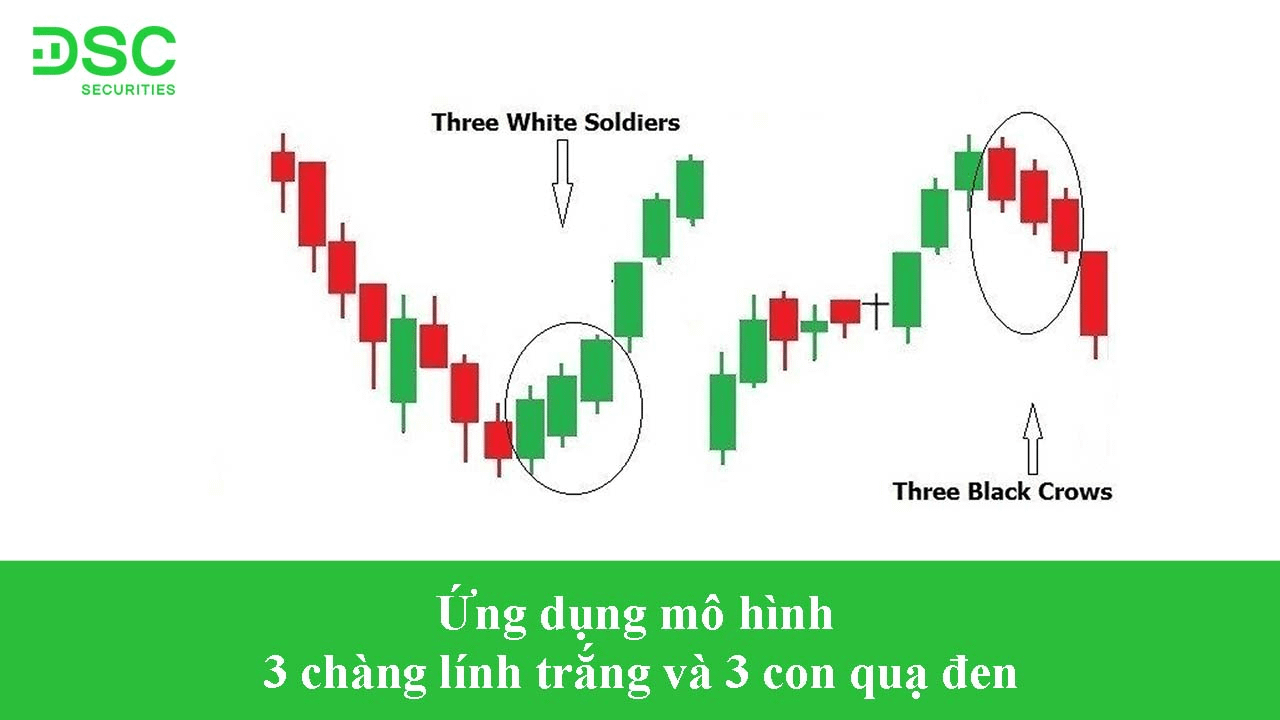
2. Three White Soldiers & Three Black Crows
Meaning: Three consecutive long-bodied candles of the same color, closing near their highs/lows. This is a signal confirming an extremely strong trend, often appearing after a consolidation phase or a sudden reversal.
3. Three Line Strike
The pattern consists of 3 candles in the same direction, followed by a reverse candle that "engulfs" all 3 previous candles. This is a continuation pattern hidden after a short-term profit-taking.
Part 5: Analysis of Neutral Candlestick Types
Candles do not always signal an increase or decrease. Sometimes they indicate hesitation.
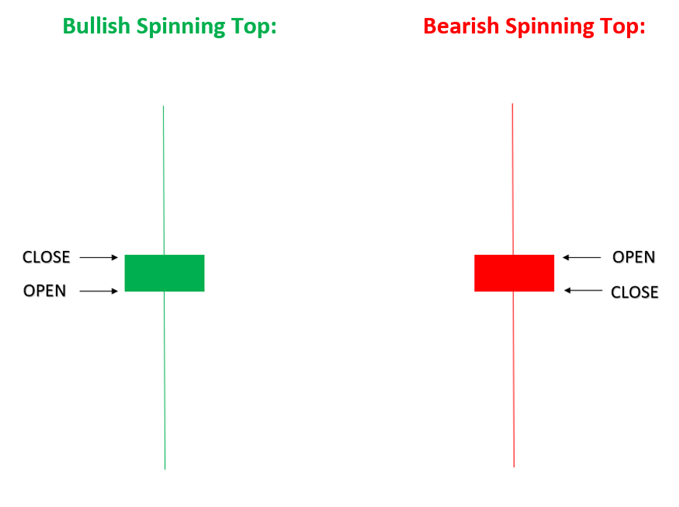
Spinning Top: Small body, with upper and lower shadows of equal length. The market is balanced, with Buyers and Sellers "struggling," but no clear winner yet.
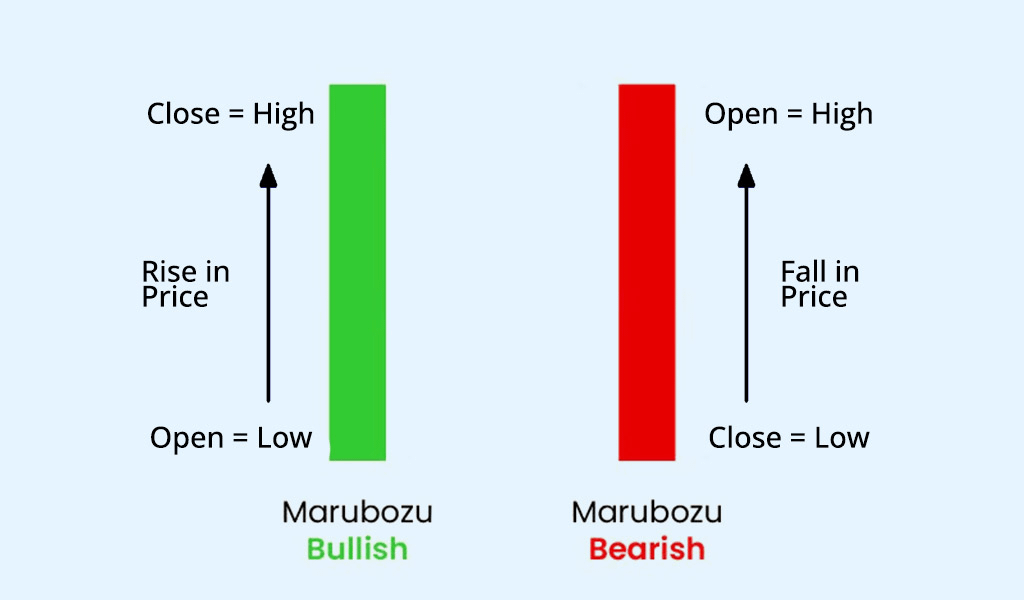
Marubozu: A candle with no shadows.
Green Marubozu: Strong buying pressure from start to finish.
Red Marubozu: Complete dominance of selling pressure.
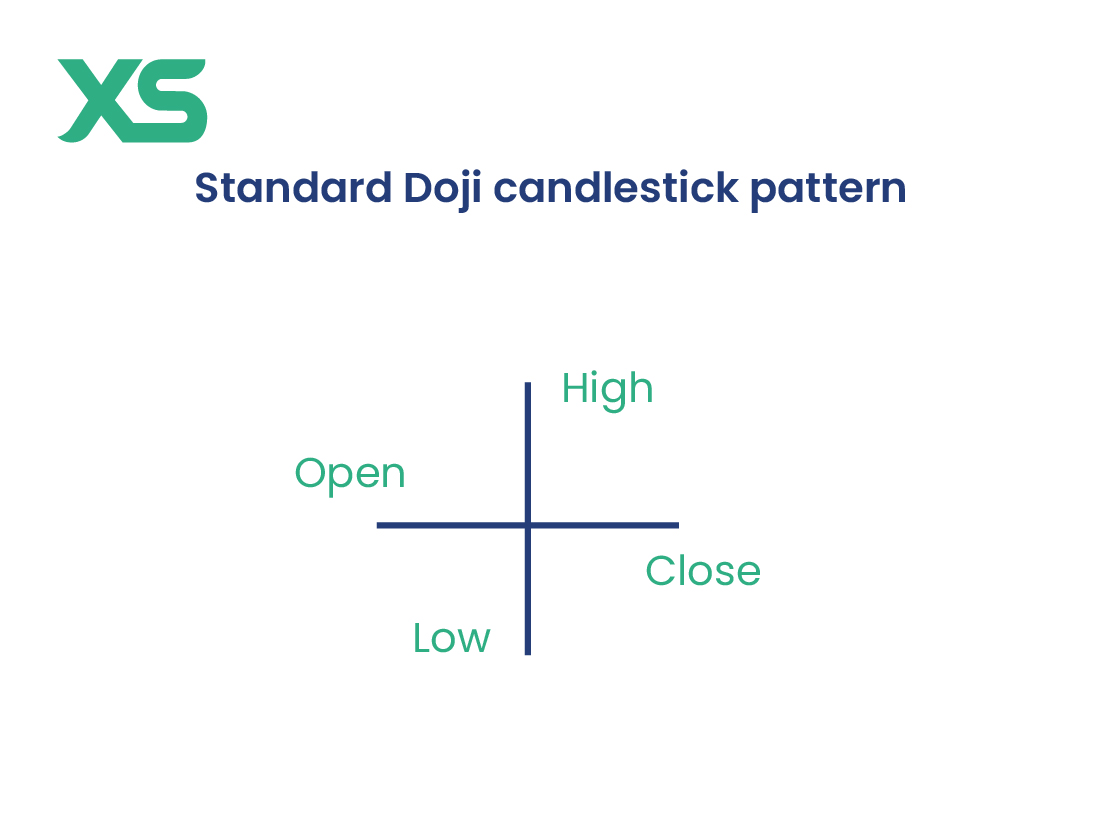
Standard Doji: Looks like a plus sign (+). Represents extreme hesitation. After a long trend, Doji is often a sign of fatigue and prepares for a reversal.
Part 6: Supplementary Candlestick Patterns
To make the analysis more complete, we need to mention other classic patterns:
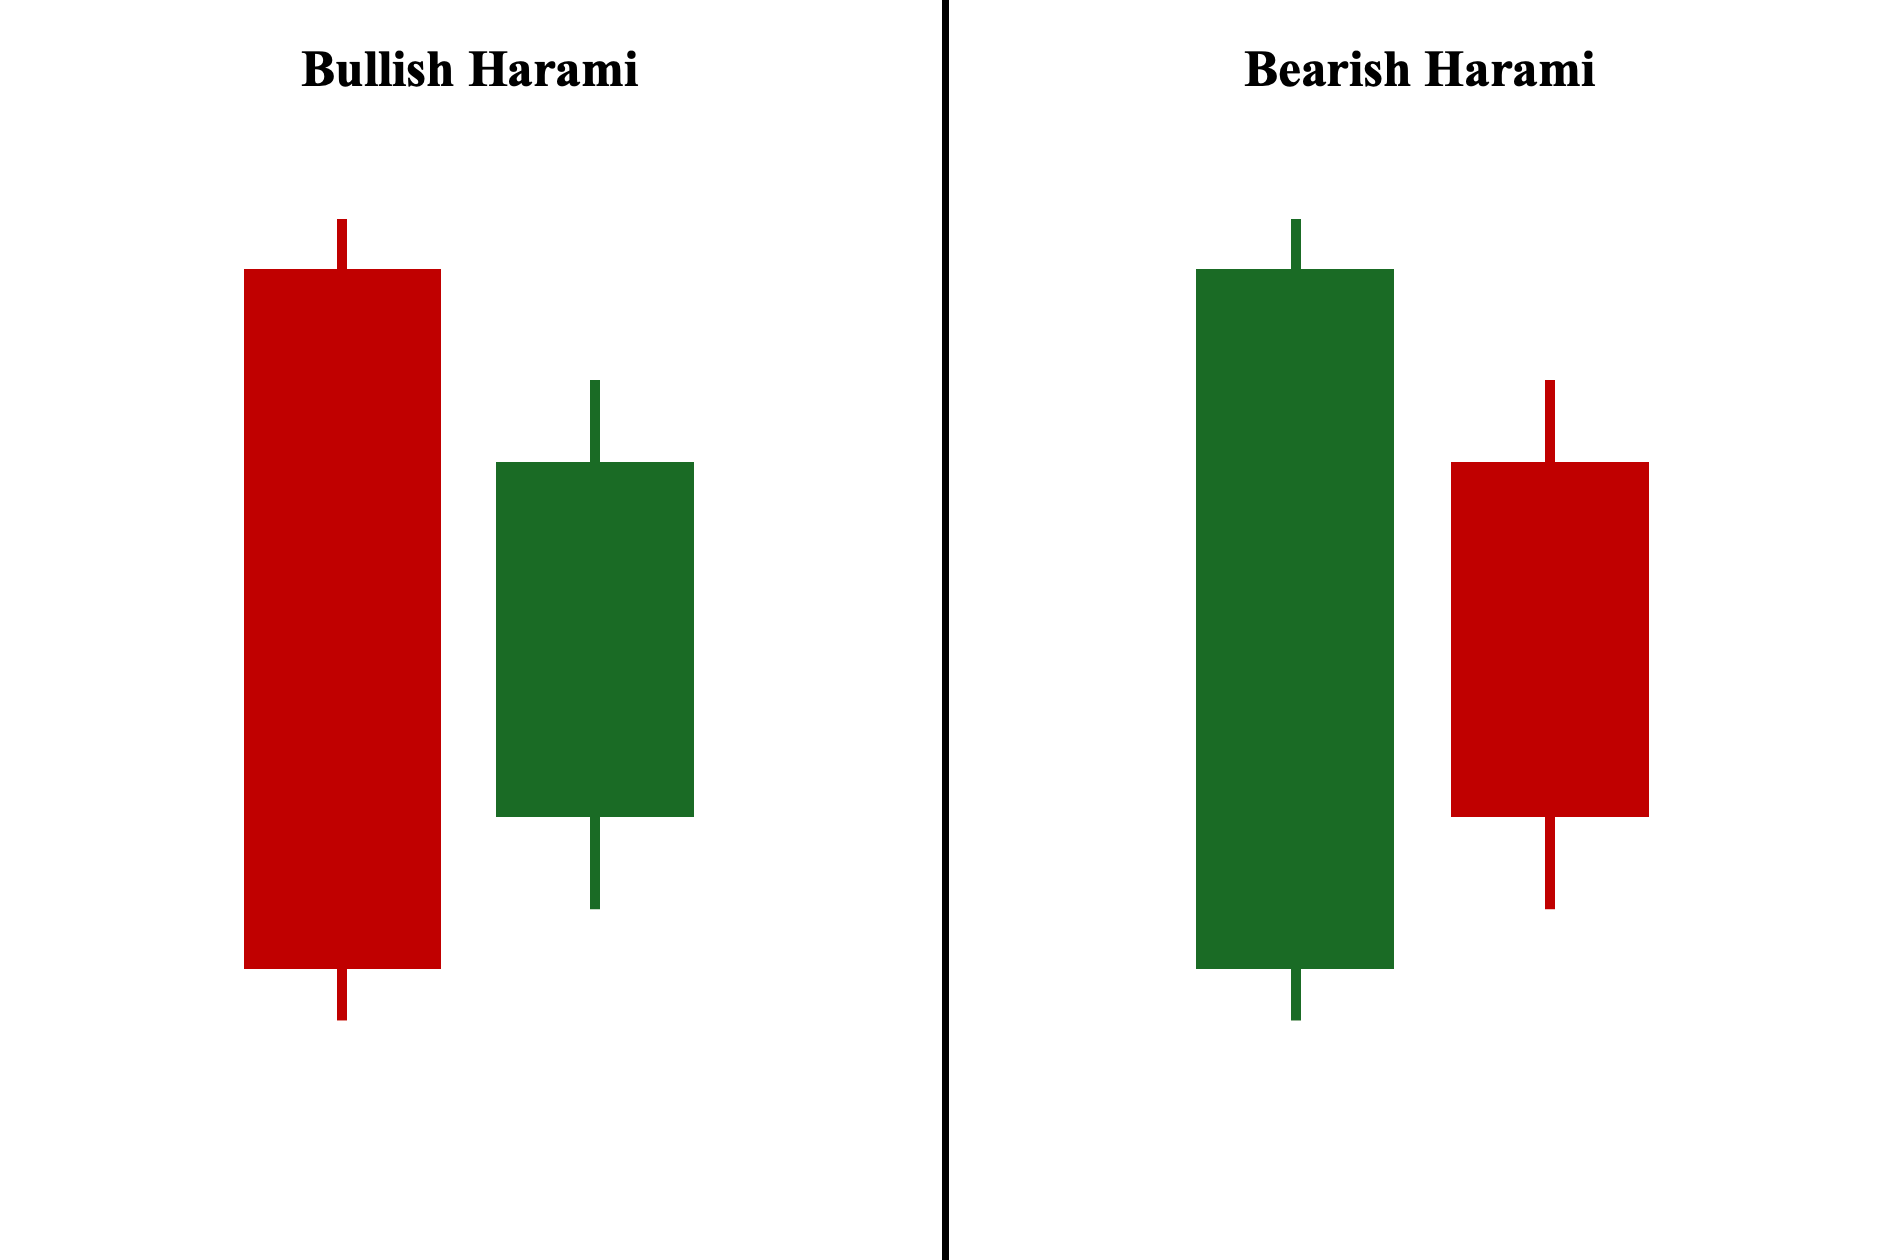
1. Harami
The second candle is contained within the body of the first candle. It indicates a pause in the current trend and prepares for a new breakout.
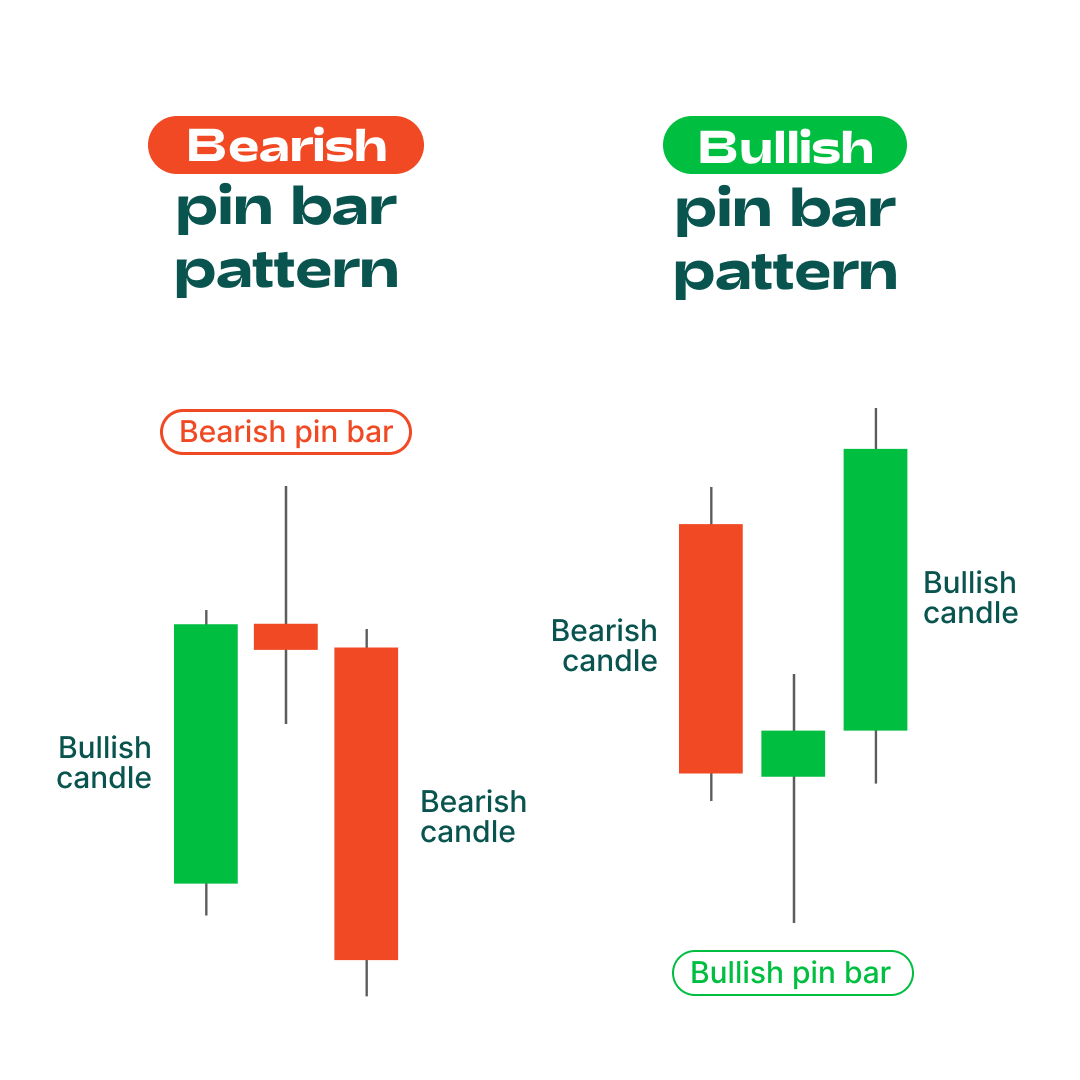
2. Pin Bar
A variant of Hammer/Shooting Star but with an extremely long candle shadow. The Pin Bar is one of the favorite tools of Price Action traders because it clearly shows price rejection.
Part 7: Trading Strategies with Japanese Candlesticks
Memorizing patterns is not enough. To succeed, you need to apply the following principles:
Location: A Hammer candle in the middle of a trend is not as valuable as a Hammer candle at a strong support area.
Confirmation: Never enter a trade based solely on one candle. Wait for the next candle to confirm the direction.
Combine indicators: Use candles along with RSI, MACD, or moving averages (MA) to increase the win rate.
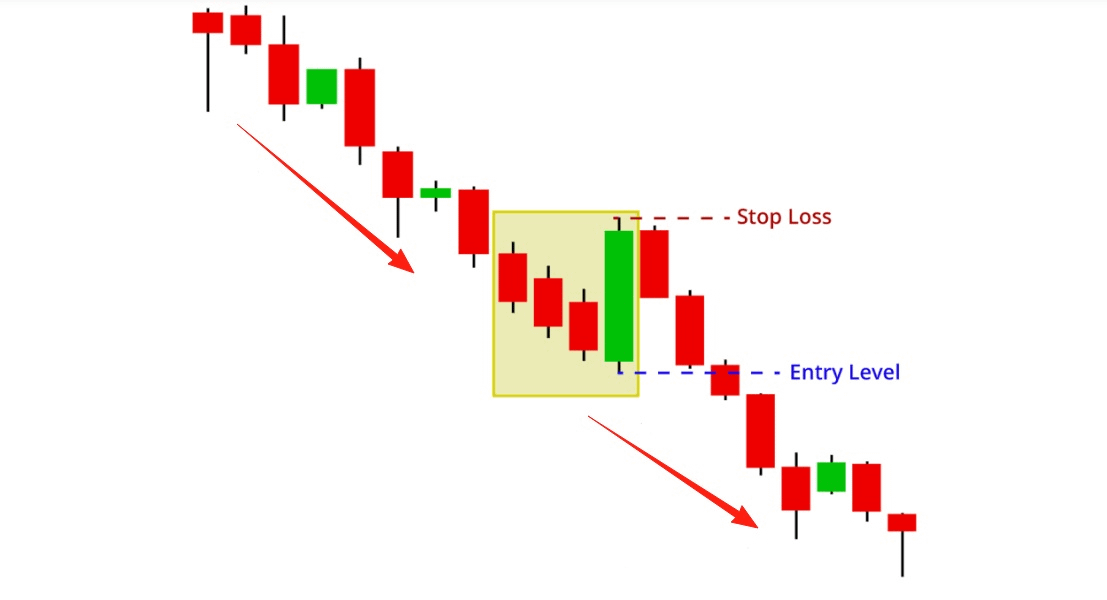
Risk management: Always place a Stop Loss behind the candle's shadow of the pattern.
Conclusion
Japanese candlestick patterns are a psychological map of the crowd. By observing the length of the body, the candle shadows, and how they combine with each other, you can predict the next move of the "Shark."
I hope this article provides you with the most insightful and comprehensive view of candlestick patterns.