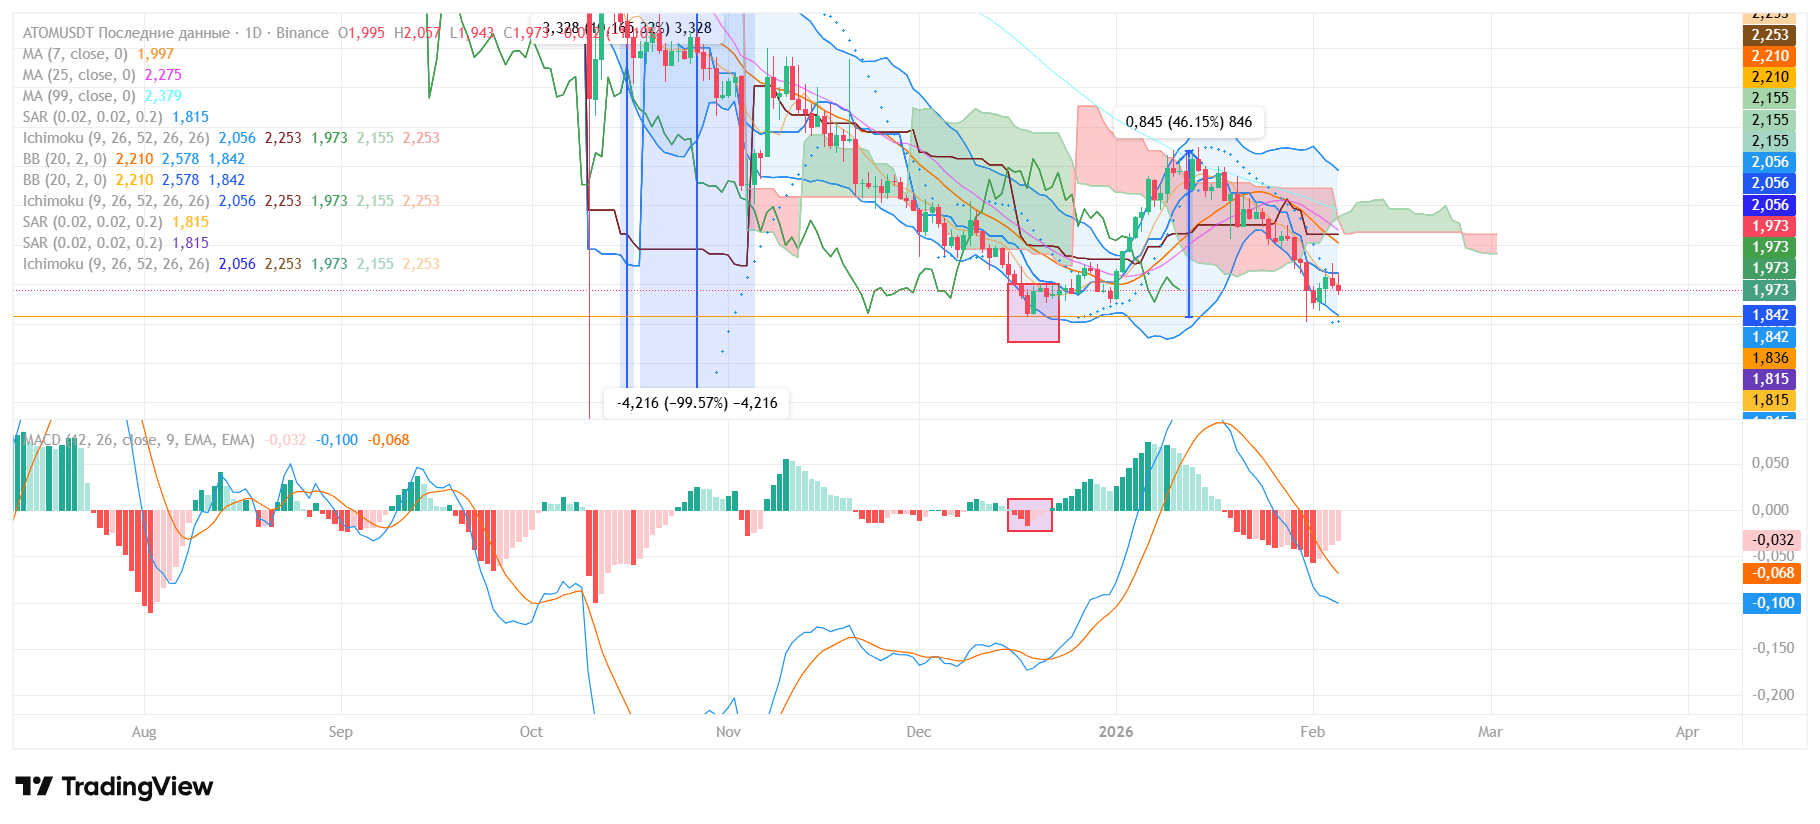
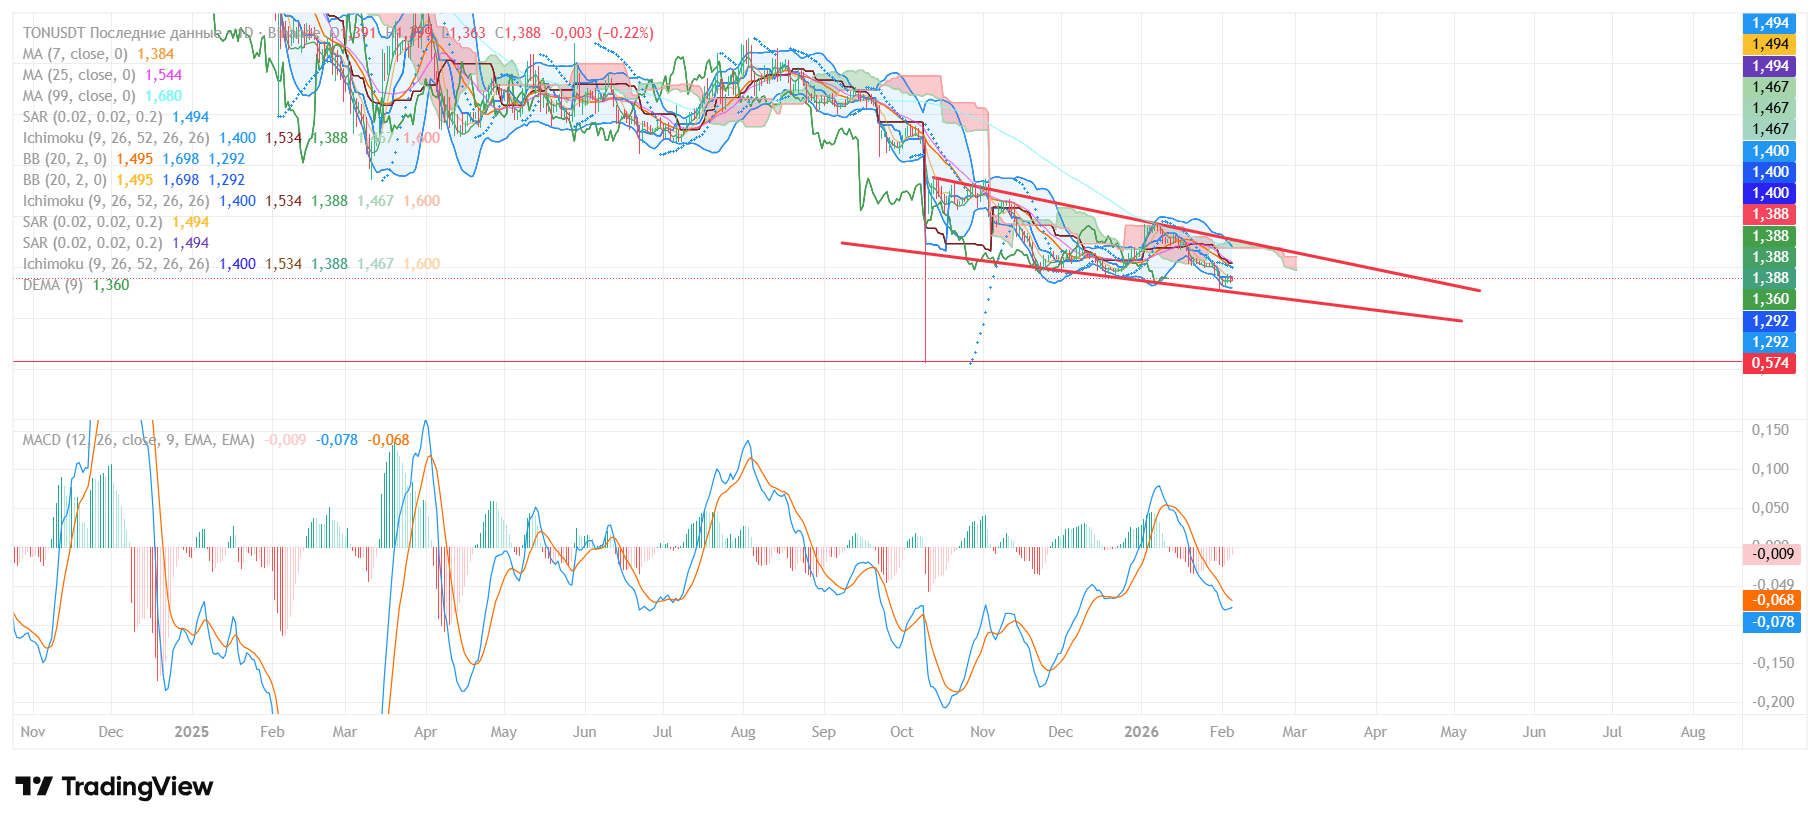
How I use MACD in real trading
MACD for me is not just a line on a chart, but a tool that shows the market's breath. It does not predict the future, but it highlights moments when the momentum changes very well. If you learn to read MACD correctly, it becomes a strong filter for entries and exits.
What MACD consists of
The indicator consists of three elements:
The MACD line is the difference between EMA(12) and EMA(26)
The signal line is EMA(9) of the MACD line
The histogram is the distance between MACD and the signal line
I always look at them as a unified system, not separately.
What I look for first
Crossing of lines.
When MACD crosses the signal line from bottom to top - for me, this is the first hint of a reversal upwards. From top to bottom - a possible beginning of a decline.
Position relative to zero.
If the indicator is above the zero line - the market is in a bullish phase. Below zero - sellers dominate.
How I read the histogram
The histogram shows the strength of the impulse:
Columns grow - the impulse strengthens
Columns decrease - the movement is fading
Often, it is through the histogram that I see the weakening of the trend earlier than through the price.
Divergences are my favorite signal
If the price makes a new high, but MACD does not, it is a bearish divergence.
If the price updates the low, and MACD rises - it is bullish.
For me, this is a signal not to enter immediately, but to prepare for a market phase change.
How I apply MACD in practice
I do not open trades solely based on MACD.
First, I determine the trend using EMA or market structure, and only then use MACD as confirmation.
Thus, the number of false entries decreases significantly.
Frequent mistakes of beginners
Trading each crossover
Ignoring the time frame
Using MACD without market context
MACD works best in a trend and worse in a flat market.
My conclusion
MACD is a momentum indicator, not a buy/sell button. When I started to perceive it as a tool for reading the strength of movement rather than a signal, the trading results became more stable.
Insight from an analyst: the strongest setup is the coincidence of trend, structure, and confirmation from MACD. Everything else is noise.
$ATOM $TON $BNB #cryptousdua #Binance