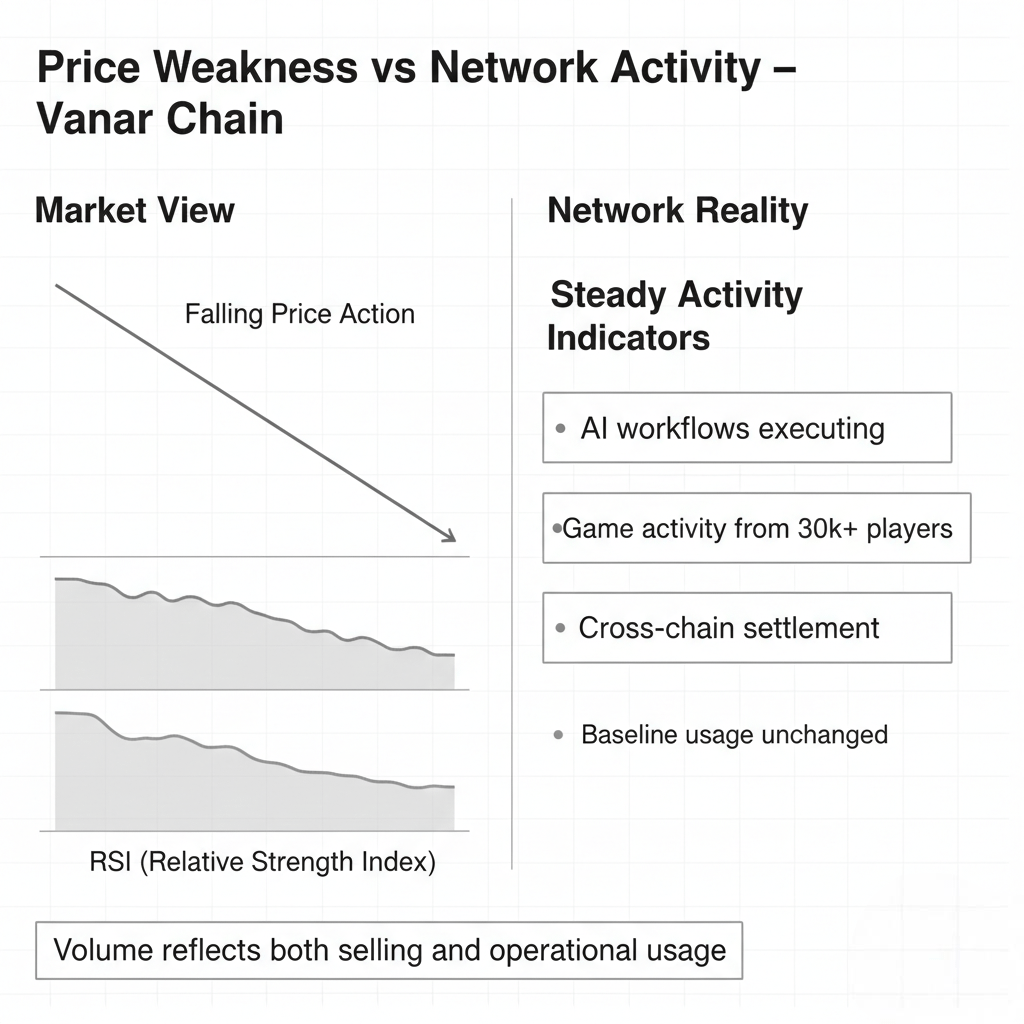
Vanar Chain caught my attention again for reasons that didn't match what the chart was showing. VANRY dropped 2.23% to $0.006176, failing yesterday's attempted recovery. RSI slid back to 38.32 after briefly touching 40.71. The 24-hour range between $0.006009 and $0.006500 looked like a failed bounce collapsing. By price action alone, this looked like continuation of weakness, maybe the start of another leg down.
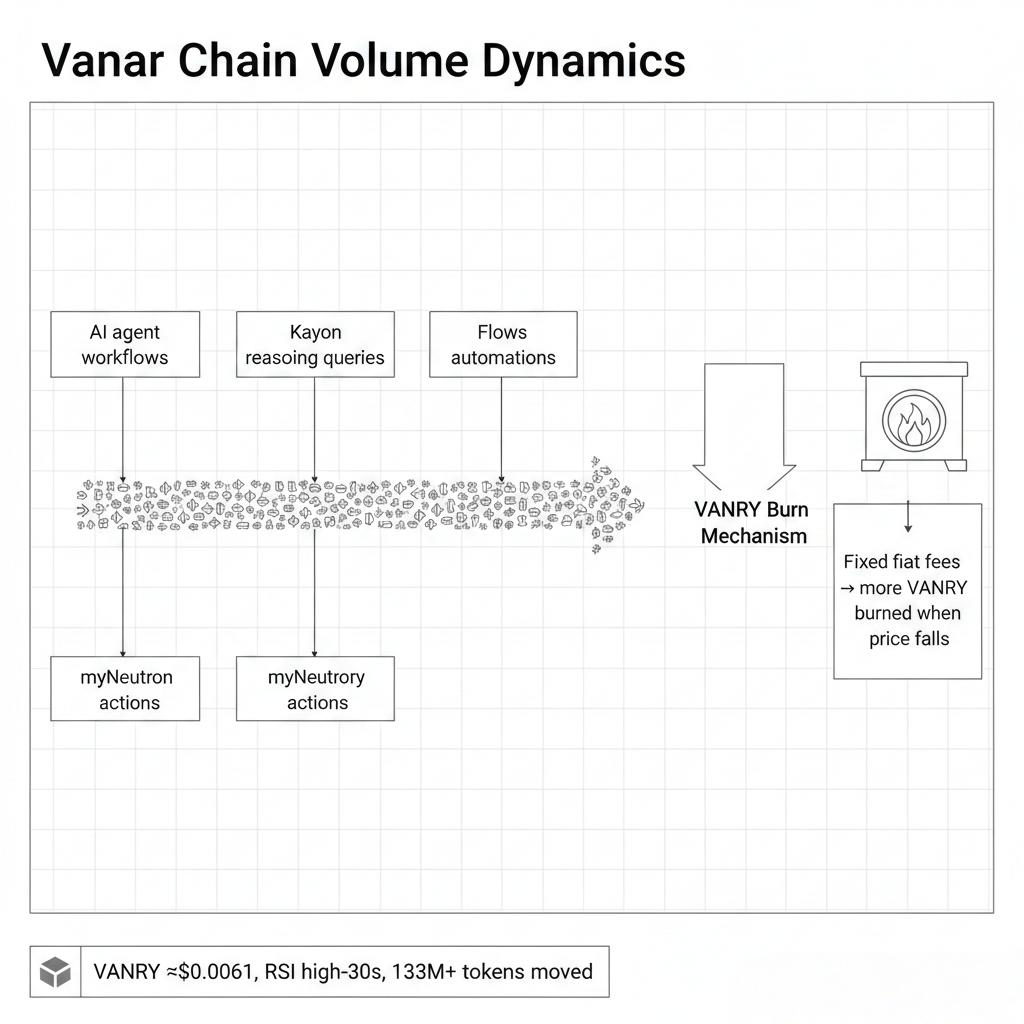
But 133.53 million VANRY tokens moved in 24 hours.
That volume number didn't fit the price narrative. When tokens dump and recoveries fail, volume usually comes from capitulation—holders giving up, selling into weakness, exiting positions. That kind of volume shows up in transaction patterns. Large transfers to exchanges. Wallet consolidation. Clear directional movement away from holding addresses.
I started looking at what types of transactions were actually happening on Vanar Chain during this high-volume period.
The pattern wasn't panic selling. It was operations.
Neutron seed creations kept processing. Kayon reasoning queries kept executing. Flow automations kept settling. These weren't large holder movements or exchange deposits. These were small, frequent transactions burning VANRY for infrastructure usage. When you see 133.53 million tokens move but network activity looks stable rather than chaotic, something other than selling pressure is generating that volume.
Vanar Chain's fixed fee structure creates unusual volume dynamics.
Every transaction costs roughly half a cent in fiat terms, paid in VANRY. When the token price is $0.006176, that half-cent transaction requires more VANRY than when price was higher. Simple math, but it creates counterintuitive volume patterns. As VANRY drops, the same amount of infrastructure usage generates higher token volume because more tokens are needed to meet the fixed fiat cost.
An AI agent executing a workflow that costs $0.005 doesn't care what VANRY is trading at. It burns whatever token amount equals that cost. At higher prices, fewer tokens. At lower prices, more tokens. The workflow executes either way because Vanar Chain designed for operational continuity, not price-dependent economics.
During this failed recovery, that dynamic showed clearly.
Applications using Vanar Chain infrastructure didn't pause because VANRY dropped 2.23%. World of Dypians with 30,000+ players kept running game state through the AI stack. Those players triggered reasoning queries through Kayon, stored memory via myNeutron, executed automated actions through Flows. Each action burned VANRY at the rate required to meet fixed fiat costs.
As price dropped, volume increased mechanically.
What looked like selling pressure in the charts was partially just higher token consumption from the same baseline activity level. Not all of it—there was real selling happening too. But enough of the volume came from operational usage that the 133.53 million token movement didn't signal complete capitulation the way it would on networks where all volume is speculative.
This creates measurement problems.
Most people look at token volume and infer market sentiment. High volume down means panic. High volume up means FOMO. That heuristic works for purely speculative assets. It breaks when a significant portion of volume comes from utility consumption that's price-insensitive.
Vanar Chain falls into an awkward middle category. Not all usage yet, but not pure speculation either.
I kept tracking individual transaction patterns to separate utility volume from trading volume. Harder than it sounds because both look like token movements on-chain. But utility transactions tend to be smaller, more frequent, and originate from application contracts rather than holder wallets. Trading volume shows up as larger transfers, exchange movements, wallet consolidation.
During this period, both types existed. Real selling was happening—holders exiting positions, speculative interest fading. But underneath that, Vanar Chain's infrastructure kept consuming VANRY at rates determined by application usage rather than market conditions.
The $830,727 USDT volume seemed low at first. But when you calculate backward from 133.53 million VANRY at an average price around $0.006200, you get roughly $828,000. The numbers match, which means the volume is real, not inflated by wash trading or fake activity.
What it represents is messier than simple bull or bear signals.
Some of that volume is holders giving up. Some is applications burning tokens for infrastructure. Some is automated market maker rebalancing. Some is cross-chain settlement between Vanar Chain and Base. The mixture makes interpretation difficult, which is probably why most people just look at price and assume volume tells a simple story.
It doesn't.
Vanar Chain's design creates volume that's partially decoupled from sentiment. Not completely—speculation still drives meaningful portion. But enough infrastructure usage exists that you can't read volume as pure market psychology anymore.
This matters for understanding what's actually happening during weakness.
If all 133.53 million tokens moved because of panic selling, Vanar Chain would be in serious trouble. Network activity would be collapsing. Developers would be pausing. Applications would be migrating. None of that is happening. What's happening is price finding a bottom while infrastructure continues operating, generating token volume through usage that doesn't care about charts.
VANRY at $0.006176 with RSI at 38.32 looks weak. It is weak. The recovery failed. Sentiment is poor. But the 133.53 million token volume isn't telling the simple capitulation story that number would suggest on a purely speculative asset.
Part of it is capitulation. Part of it is operations. And separating those two becomes critical for understanding whether Vanar Chain is actually losing adoption or just experiencing normal market weakness while infrastructure keeps running underneath.
I don't have a clean answer yet. The data is too mixed. But watching token volume spike while price drops, and seeing that volume include significant infrastructure usage rather than pure selling, reveals something about what happens when you build for utility rather than just speculation.
The volume tells a more complicated story than the price chart suggests. Whether that complexity matters long-term depends on whether infrastructure usage keeps growing even when markets don't care. For now, it's just an unusual pattern worth noticing in a space where most volume patterns are simple and sentiment-driven.