$ZAMA is currently trading near $0.02107, reflecting a 5.64% daily decline, signaling short-term bearish pressure in the market. The recent drop suggests either profit-taking after prior price movement or broader weakness across mid- and small-cap altcoins. With price now hovering just above the $0.020 psychological support level, this zone becomes technically important. A strong hold above $0.020 could trigger consolidation and potential relief bounce, while a decisive breakdown may open the door for further downside in the short term.
From a technical perspective, momentum appears cautious. The recent red candles indicate sellers currently have control, but the intensity of the next move will largely depend on trading volume. If selling volume increases alongside further price decline, it would confirm stronger bearish continuation. On the other hand, declining volume during the dip could signal weakening selling pressure, increasing the probability of stabilization. Traders should closely monitor reaction around the $0.020 support area, as this level may determine whether $ZAMA enters a recovery phase or extends its correction.
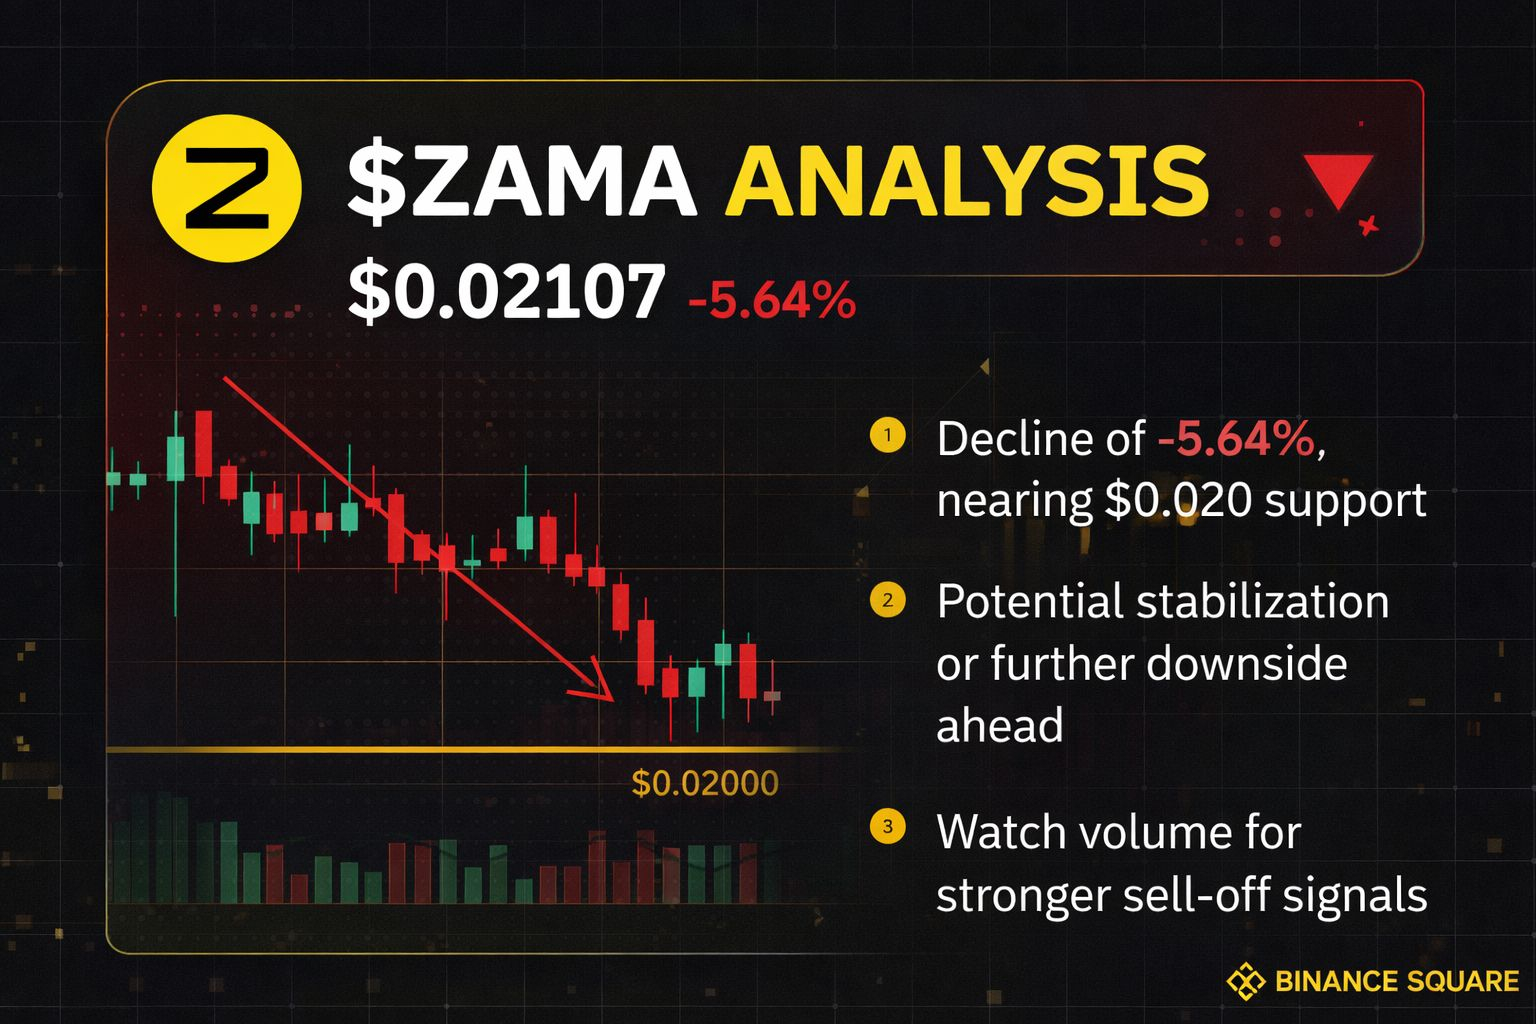
Overall, $ZAMA s in a short-term corrective phase, with the broader crypto market sentiment likely playing a major role in its next directional move. Risk management remains essential, especially in volatile conditions, as smaller-cap assets tend to experience sharper price swings compared to large-cap cryptocurrencies.