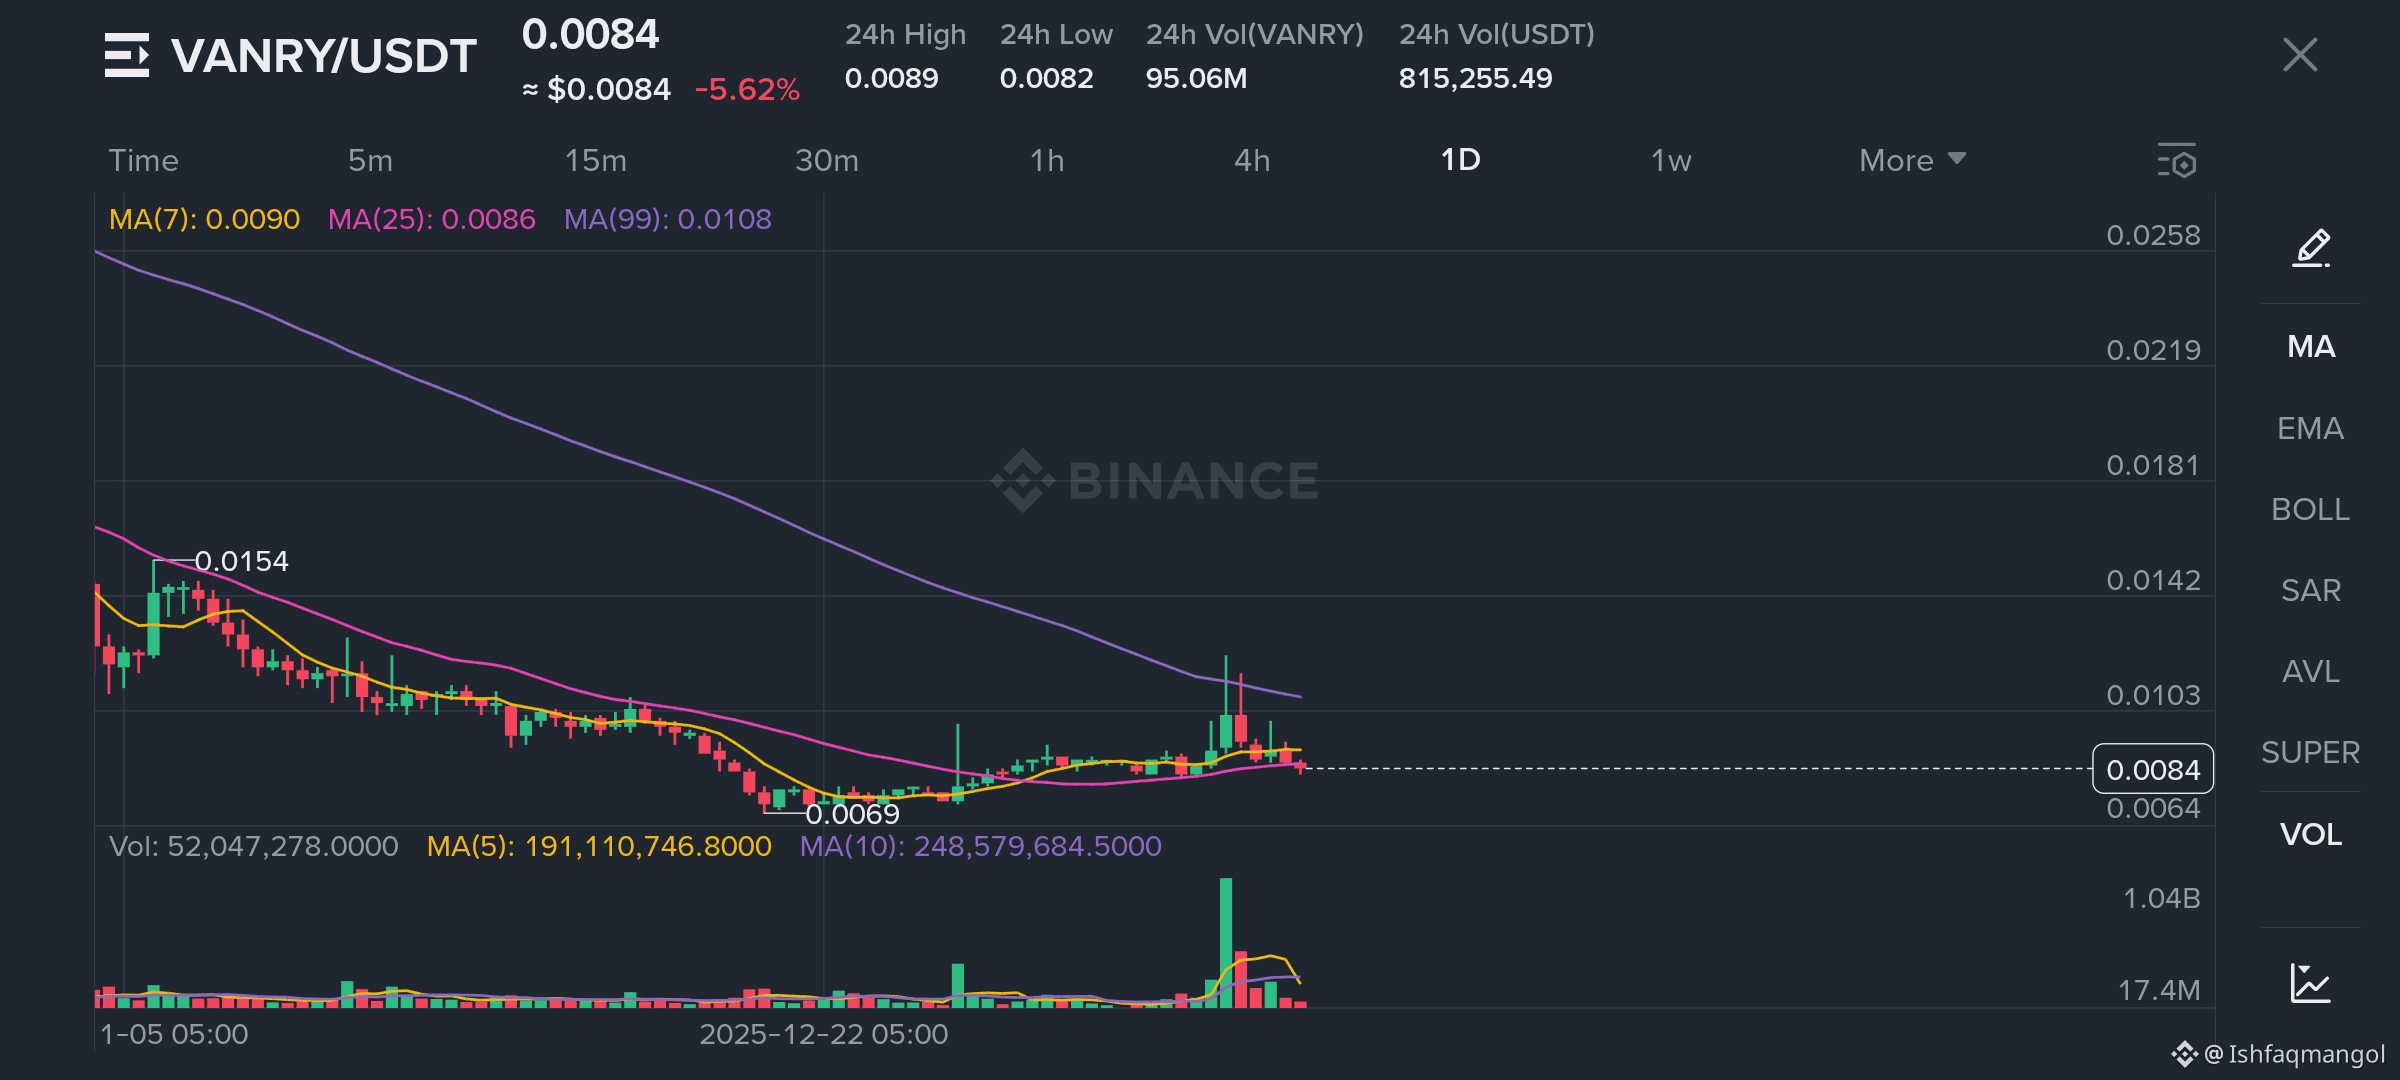
This daily chart for $VANRY on the Binance exchange provides a comprehensive look at the recent price action and technical health of the Vanar Chain token. Currently trading at $0.0084, the asset is experiencing a period of significant volatility and downward pressure, characterized by a 5.62% decline in the last 24 hours. To understand where the price might be heading, we must break down the trend, the moving averages, and the volume profile.
Price Action and Trend Analysis
Looking at the historical data on this 1D chart, VANRY has been in a persistent long-term downtrend. The price peaked significantly at $0.0154 before entering a distribution phase. This was followed by a sharp decline that eventually found a local floor (support) at $0.0069.
Recently, there was a notable attempt at a recovery. You can see a sharp "impulse move" where the price spiked toward the $0.0103 level. However, this move was met with immediate selling pressure, leaving behind a long "upper wick" on the candles. This suggests that while buyers are interested at lower levels, there is a heavy supply of sellers waiting near the $0.0100 mark, preventing a sustained breakout.
The Moving Averages on this chart tell a story of resistance. Currently, the price is trading below all three major indicators shown:
MA(7) - Yellow ($0.0090): This short-term average is currently acting as immediate overhead resistance. The price needs to reclaim this level to show any short-term bullish momentum.
MA(25) - Pink ($0.0086): The price is hovering just below this medium-term average, indicating a lack of clear trend direction and a slight bearish bias.
MA(99) - Purple ($0.0108): This is the "big picture" indicator. As long as the price remains below the 99-day MA, the asset is technically in a macro downtrend. The recent price spike failed precisely as it approached this purple line, confirming it as a "hard" resistance level.
Volume and Market Interest
The volume bars at the bottom of the chart provide crucial context. We see a massive green volume spike coinciding with the recent price jump. This indicates a "surge" of liquidity—perhaps due to a news event or a large buyer entering the market. However, the subsequent volume bars have decreased in size while the price has drifted sideways or downward. This "descending volume" during a price retracement suggests that the initial buying hype is fading, and the market is entering a consolidation phase.
Technical Outlook
For a bullish reversal, VANRY needs to consolidate above the $0.0080 support level and then break through the $0.0090 (MA7) and $0.0108 (MA99) hurdles with high volume. If it fails to hold the $0.0080 area, a retest of the previous low at $0.0069 is highly likely. The current "Death Cross" environment (where shorter-term averages are below longer-term ones) suggests caution for long-term investors until a clear "Golden Cross" or a breakout above the MA(99) occurs.